
Chart of the Week: #BlackFuturesMonth
To add equity data to the national dialogue about growth and prosperity, every week the National Equity Atlas team posts a new chart from the Equity Atlas related to current events and issues.
Just in time to celebrate the culmination of Black History Month and Black Futures Month, the National Equity Atlas team is thrilled to relaunch the Chart of the Week series. This week, we are honoring the reality of Black existence and Black joy. Our vision of equity is a society where all Black people can participate, prosper, and reach their full potential. To put a dollar amount to the potential gains for the Black population if this vision of equity were achieved, we compared actual Black income to a scenario of racial equity in income for the population ages 16 and older.
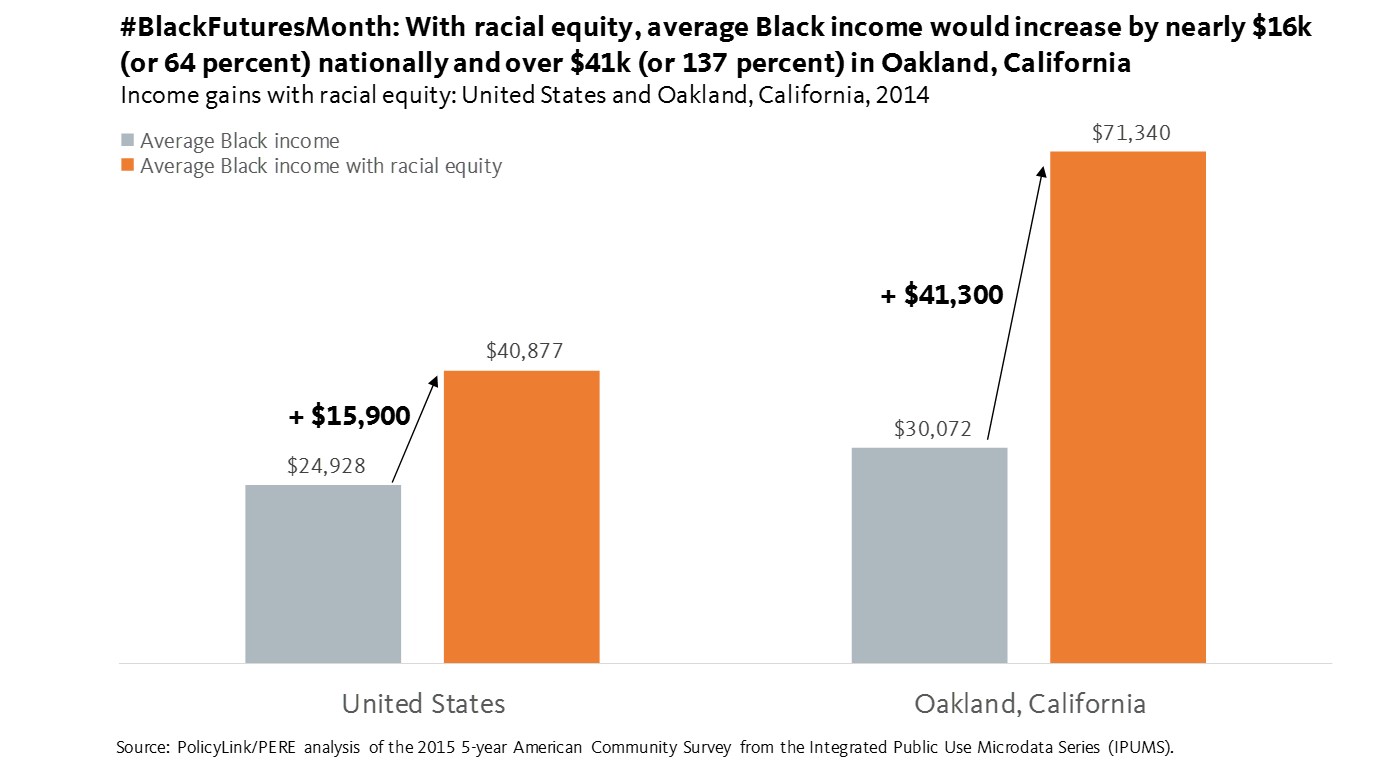
Nationally, average Black income was $24,928 in 2015 (as the chart below details). But if Black people had the same age-adjusted income distribution as non-Hispanic Whites, average Black income would be nearly $41,000, an increase of 64 percent. In the City of Oakland, California, average Black income was $30,072 in 2015. But with racial equity, this number would have been over $71,000, a staggering 137 percent increase. The potential gains in Oakland are substantially higher than the national gains because average White income in Oakland is nearly double the average White income nationally. But average Black income in Oakland is just $6,000 more than average Black income nationally, despite being in one of the most expensive metro areas in the country.
Closing racial gaps in wage and employment can be achieved by eliminating discrimination in pay and hiring, boosting educational attainment, and ensuring strong and rising wages for low-wage workers. Policies that focus on these goals are good for families, good for communities, and good for the economy. National Equity Atlas data show that in Oakland, income gains for the Black population are evenly split between an increase in wages and employment, which we measure by the number of hours worked. Strategies that address both factors include ending wage theft and strengthening workers’ rights to organize as well as helping Black entrepreneurs start and scale-up their businesses. With racial equity in wages and employment, Black families would have more money to not just survive, but thrive and plan for the future.
To see the newly updated gains in Black income with racial equity for your community (we just released the 2015 data!), visit the National Equity Atlas and type in your city or state. Download and share the chart on social media using#BlackFuturesMonth and #equitydata.