
Chart of the Week: Addressing Working Poverty Critical for Equitable Development in Pittsburgh
To add equity data to the national dialogue about growth and prosperity, every week the National Equity Atlas team posts a new chart from the Equity Atlas related to current events and issues.
This week, PolicyLink joined more than 600 participants at the second p4 conference in Pittsburgh to discuss how to create a new sustainable, innovative, and inclusive model for development designed to establish Pittsburgh as a city of the future. This includes acknowledging how historical and institutionalized practices of discrimination continue to impact the economic and health outcomes of people of color today.
To provide additional context for the conference and the p4 initiative moving forward, this week’s chart looks at working poverty by race/ethnicity and gender in the city.
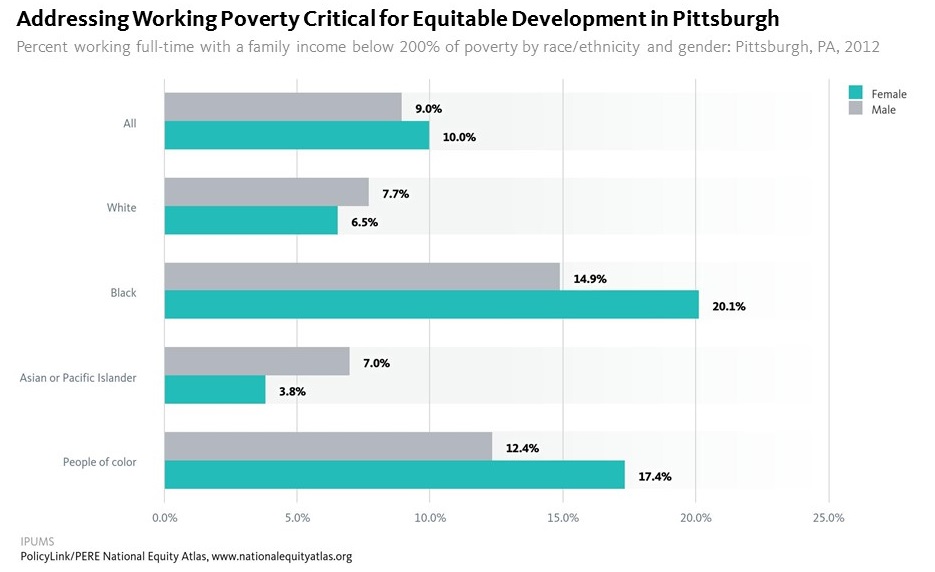
As the chart shows, Black women have the highest rates of working poverty in Pittsburgh. One in five Black women ages 25 to 64 is working full time with a family income less than 200 percent of poverty compared with 15 percent of Black men and just 8 percent of White men. Black women are three times more likely than White women in the city to be working poor. Asian women are the least likely to be working poor.
Equitable development requires an intentional focus on eliminating these racial inequities and barriers, and making accountable and catalytic investments to assure that the lower-wealth residents connect to economic and ownership opportunities. To learn more about an equitable development strategy that works to ensure that everyone participates in and benefits from the region’s economic transformation—especially low income residents, communities of color, immigrants, and others at risk of being left behind—read the new PolicyLink report: Equitable Development: The Path to an All-In Pittsburgh.
To view how working poverty varies by race/ethnicity and gender in your community, visit the National Equity Atlas, select the “By gender” breakdown, and type in your city, region, or state. Download the chart and share it on social media using #p4pgh and #equitydata.