Employment Equity A Key Theme at Atlanta’s Just Opportunity Summit

June 21, 2019: Just Opportunity Summit morning panel on leveraging and mitigating public incentives for economic inclusion. Credit: Kelly Jordan

If there were employment equity "More people with jobs will have enough money to spend in their communities, moving everyone up the socio-economic ladder" writes Nathaniel Smith, Founder and Chief Equity Officer of the Partnership for Southern Equity (PSE) in The Atlanta Voice. "The opportunities are going to those who have access to them — and that's disproportionately not the members of communities of color."

Referencing the report published by the National Equity Atlas in partnership with PSE, Smith states that "the Just Opportunity Summit is grounded in the belief of equity and hard data. According to the Employment Equity Report, 'achieving true 'full employment' across all racial and gender groups — bringing 384,000 more workers into employment — would add $2.4 billion in new state and local tax revenue annually'. The hypothesis is that the more people with jobs will have enough money to spend in their communities, moving everyone up the socio-economic ladder. The Just Opportunity Summit is aimed at making this into a reality, not just for Georgia, but throughout the American South." The same report also states that employment equity would lead to almost 115,000 fewer residents living in poverty; and more than $2.4 billion in additional tax revenue. 

Racial equity in employment, economic mobility, and wealth were key themes of the inaugural Just Opportunity Summit held June 20-21 at Morehouse College hosted by PSE and the Just Opportunity Circle. Partnership for Southern Equity is a nonprofit advocacy organization that advances policies and institutional actions that promote racial equity and shared prosperity for all in the growth of metropolitan Atlanta and the American South, and the Just Opportunity Circle represents an organized group of key regional economic development leaders from the private, nonprofit, and government sectors. The Summit included workshops and panel discussions on topics such as closing the racial wealth gap, leveraging public incentives for economic inclusion, and expanding access to capital for entrepreneurs of color.

Click here to learn more about the Just Opportunity Summit, or here to see photos and recordings from the event.  
National Equity Atlas Update


Dear Atlas Users,

Happy Summer! Early in June, we were thrilled to launch the Bay Area Equity Atlas as a new local and data policy tool. Join us for a webinar next month to explore its housing indicators and how the data can be used to prevent displacement and protect renters. This month, the National Equity Atlas team added new entrepreneurship indicators, which we will be exploring in a webinar on Thursday. We hope you will join us!
 
Join Us for the Launch of Equitable Entrepreneurship Indicators
Businesses owned by people of color make up a significant and growing share of companies in cities across the country, yet the racial wealth gap and lack of access to capital stifle entrepreneurs of color and communities lose out on the jobs, services, and financial security that come with business development and growth. To equip communities with data on entrepreneurship, we are adding four indicators of business growth and diversity to the Atlas based on the Census Bureau’s 2007 and 2012 Survey of Business Owners. Join our webinar on Thursday, June 27 to learn about these indicators and hear from Gary Cunningham, president-elect of Prosperity Now, and janera solomon, executive director of Kelly Strayhorn Theater in Pittsburgh, about local strategies to foster equitable entrepreneurship. Register here.
 
Advancing Racial and Economic Equity at Atlanta’s Just Opportunity Summit
Racial equity in employment, economic mobility, and wealth were key themes of the inaugural Just Opportunity Summit held June 20-21 at Morehouse College in Atlanta hosted by the Partnership for Southern Equity and the Just Opportunity Circle. Last year, we released Employment Equity: Putting Georgia on the Path to Inclusive Prosperity with Partnership for Southern Equity (PSE) and Nathaniel Smith, the organization’s founder and chief equity officer, remarked that “the Summit is grounded in the belief of equity and hard data.” Read more in our Data in Action post here.

Using Bay Area Equity Atlas Data to Prevent Displacement and Protect Renters
The housing crisis is a key equity challenge in the Bay Area, and to support communities in protecting renters from rising rents and displacement, Bay Area Equity Atlas includes indicators such as market rent, rent burden, gentrification risk, and the potential economic gains of eliminating rent burden. Join us for a webinar on July 23 to learn about these indicators and hear from community groups working on tenant protections campaigns in Concord, Hayward, Oakland, and San Jose. Register here.
 
In the News
The launch of the Bay Area Equity Atlas was covered by SFGate, CBS San Francisco, Napa Valley Register and SF Bay. It’s mission, background, and features were also highlighted by Philanthropy News Digest.
 
 
Thank you for your interest in our work!

The National Equity Atlas team at PolicyLink and the USC Program for Environmental and Regional Equity (PERE)

National Equity Atlas Update

Dear Atlas Users,

We are thrilled to announce the launch of the Bay Area Equity Atlas today! This new local data and policy tool includes several new and upgraded features we will be transferring to the National Equity Atlas later this year. Join tomorrow’s webinar to take a tour of the Atlas and see a preview of what is to come. We are also excited to share new data on entrepreneurship with you on our webinar June 27th.

Introducing the Bay Area Equity Atlas
Produced in partnership with the San Francisco Foundation, the Bay Area Equity Atlas brings the power of the National Equity Atlas down to the local level. This new community data resource provides 21 equity metrics disaggregated by race, gender, and income and tracking change over time for 272 geographies across the Bay Area region, including 220 cities and Census Designated Places. Fourteen are new indicators that are not included in the Atlas, including voting, diversity of electeds, and police use of force. Read the team’s welcome blog post about how this tool helps to democratize power, then learn about five essential features that makes the Bay Area Equity Atlas a next-generation community data tool. There’s also still time to sign up for tomorrow’s webinar.

Join Us for the Launch of Entrepreneurship Indicators
Businesses owned by people of color make up a significant and growing share of companies in cities across the country, yet the racial wealth gap and lack of access to capital stifle entrepreneurs of color and communities lose out on the jobs, services, and financial security that come with business development and growth. To equip communities with data on entrepreneurship, we are adding four indicators of business growth and diversity to the Atlas based on the Census Bureau’s 2007 and 2012 Survey of Business Owners. Join us on this webinar to learn about these indicators and hear from Gary Cunningham, president-elect of Prosperity Now, about strategies that support work to foster equitable entrepreneurship.

In the News
In early May, Tampa Bay Newspapers highlighted the findings from An Equity Profile of Pinellas County. Later in the month, Streetsblog USA covered a Salud America! report that used Atlas data to detail transportation equity challenges in Latinx communities. This nola.com article also focuses on transportation equity, but uses Atlas data about housing burden to make the case for housing and infrastructure investments to ease the burden.

On the Road
The Atlas team had a busy month presenting our data and insights at the Rise Together Opportunity Summit in San Jose; the GEO Conference in Seattle; the Madison Region Economic Development & Diversity Summit in Madison, Wisconsin; and the National Academies’ Committee Informing the Development of Healthy People 2030.


Thank you for your interest in our work.

The National Equity Atlas team at PolicyLink and the USC Program for Environmental and Regional Equity (PERE)

National Equity Atlas Update

Dear Atlas Users,

Happy Spring! Our team is excited to see our data informing comprehensive equity strategies in Pinellas County, FL and water equity efforts in Buffalo, NY. And we are hard at work getting ready to launch the Bay Area Equity Atlas!
 
Pinella County Equity Profile Release
This month, in partnership with UNITE Pinellas, our team released a new equity profile and summary of Pinellas County, FL. The release event drew over 400 people, ranging from high school students to community and organizational leaders eager to understand the data and take action. Anand Subramanian of PolicyLink presented the keynote and moderated a panel with representatives from the City of St. Petersburg, Pinellas County Commission, A New Deal for St. Pete, and the St. Petersburg Police Department. The report serves as a launching point for UNITE Pinellas and the members of its collaborative to orient their policy, systems, and narrative change strategies moving forward. The release event was covered in the St. Pete Catalyst and the Tampa Bay Times.
 
Buffalo’s Equitable Water Future
Earlier this month, the US Water Alliance and Buffalo’s Water Equity Task Force released “An Equitable Water Future: Buffalo,” a first-ever report on the connections between water management and equity in the city. The report uses Atlas data to make the connection between disparities in wealth and housing, and how those factors affect water systems. It argues that making water systems more equitable means ensuring that all people have access to safe, affordable water, and benefit from high-quality infrastructure and public amenities like waterfront parks.
 
Thank you for your interest in our work!

The National Equity Atlas team at PolicyLink and the USC Program for Environmental and Regional Equity (PERE)

National Equity Atlas Update

Dear Atlas Users,

Greetings from the National Equity Atlas team! This month, we released a new equity profile for Orange County, California. And we were thrilled to see our data on wage disparities used to power policy advocacy in Cincinnati!
 
Orange County Equity Report Release
On March 26, about 300 people gathered at the Bowers Museum in Santa Ana for the release event for An Equity Profile of Orange County, completed in partnership with Orange County Grantmakers. The presentation of data revealing stark inequities within the wealthy county made many participants uncomfortable — and ready to take action. Reacting to the presentation of the data by Dr. Manuel Pastor, Rosie Perez of Mission Integration at Providence St. Joseph Hospital said “I am motivated by the findings. I think it can bring all of us together to work toward equity.”

Cincinnati Leverages Equity Data to Win New Wage Equity Policy
On March 13, Cincinnati City Council barred employers from asking applicants about their salary history in an attempt to reduce wage disparities between men and women in the region. This was the direct result of advocacy by the Greater Cincinnati Foundation’s Women’s Fund, using data from our equity profile along with coalition building support from the PolicyLink All-In Cities initiative. The Cincinnati Business Courier and CityBeat covered the passing of the new ordinance.

Omaha Equitable Growth Profile Wins Planning Award
Our partners at the Metropolitan Area Planning Agency and the Heartland 2050 initiative received an award from the Nebraska chapter of the American Planning Association for their work using the Equitable Growth Profile of the Omaha-Council Bluffs Region to drive equity planning in the region. Since the profile was released in July, local leaders have used the data to inform multiple planning efforts spanning health, housing, transportation, and leadership development, including the United Way of the Midland’s Community Food Plan, the Douglas County Community Health Improvement Plan, and the City of Omaha’s Transit Oriented Development Initiative.

Join Our Team: PolicyLink is Hiring a Director for Our Equity Data Team
Love the Atlas? Come work with us! PolicyLink is seeking a director to lead our growing portfolio of work that leverages data to advance racial and economic equity. The director will have principal responsibility for the day-to-day management of the National Equity Atlas and the forthcoming Bay Area Equity Atlas and lead the development of other high-impact quantitative and mixed-methods analyses and data tools. Find the job description and instructions on how to apply here.

In the News
The Los Angeles Times used Atlas data on the housing burdens faced by minimum wage workers in Oakland in an article about the Athletics baseball team building housing units alongside their new stadium.

Thank you for your interest in our work!

The National Equity Atlas team at PolicyLink and the USC Program for Environmental and Regional Equity (PERE)

National Equity Atlas Update

Dear Atlas Users,

Greetings from the National Equity Atlas team! This month, we released a new equity profile for the city of Long Beach. We are also happy to see our research on Sacramento and Long Island being used to advance equitable growth policies in those communities.
 
Long Beach Equity Report Release
On February 5, the National Equity Atlas team, in partnership with Citi Community Development, the Long Beach Office of Equity, and Councilmember Rex Richardson’s Office, released an Equitable Growth Profile of the City of Long Beach at Long Beach City College Pacific Coast Campus. One hundred participants attended the event, including residents, nonprofit and philanthropic leaders, city officials, and staff. Dr. Manuel Pastor gave the keynote address, highlighting the benefits of racial economic inclusion and the importance of using data not only disaggregated by race/ethnicity, but also by immigrant status and ancestry to advance equity and shift policy. “These aren’t crazy things,” said Brian Addison in an article about the report’s policy recommendations in the Long Beach Post. “They’re doable. They’re respectable. And if we want to keep Long Beach, well, Long Beach, we have to actually start implementing them.”
 
Join Our Team: PolicyLink is Hiring a Director for Our Equity Data Team
Love the Atlas? Come work with us! PolicyLink is seeking a director to lead our growing portfolio of work that leverages data to advance racial and economic equity. The director will have principal responsibility for the day-to-day management of the National Equity Atlas and the forthcoming Bay Area Equity Atlas and lead the development of other high-impact quantitative and mixed-methods analyses and data tools. Find the job description and instructions on how to apply here.

California Data Sources
The Atlas was included in a crowdsourced compilation of data sources advocates turn to when they need publicly available data about California. Originally created for the communities participating in the California Accountable Communities for Health Initiative, Hillcrest Advisory currently maintains the regularly updated catalog.
 
In the News
Atlas data was used in the first of six longform reports by Hawaii Business magazine about families struggling to get by in the state. Sacramento News & Review provided coverage on a white paper released by the Sacramento Housing Alliance that included Atlas data on local rent increases. Our fact sheet on rent burdens in Chicago was cited in an In These Times cover article on grassroots organizing in the city. Nassau County Comptroller Jack Schnirman released a report on Black economic equity in the Long Island, NY county, which references a National Equity Atlas report from 2017. Newsday and The Island Now wrote about the report and its release event.
 
Thank you for your interest in our work!

The National Equity Atlas team at PolicyLink and the USC Program for Environmental and Regional Equity (PERE)

National Equity Atlas Update: Year in Review

Dear Atlas Users,

Happy Holidays from the National Equity Atlas team! We are thankful for another fruitful year of collaborations with local coalitions and community leaders on data projects that empower collective action, undergird advocacy, and inform policies to advance racial equity and inclusive prosperity. Here are some highlights from the past year:

Employment Equity in Southern States

In partnership with collaboratives and organizations in each state, we released a series of five briefs that lay out policy roadmaps for Georgia, Alabama, Mississippi, North Carolina, and Louisiana. These briefs were all based on data analyses and modeling of a “full-employment economy,” defined as when everyone who wants a job can find one, as well as focus groups with workers seeking good jobs These reports are undergirding the employment equity work of our partners, Partnership for Southern Equity, Alabama Asset-Building Coalition, Mississippi Low-Income Child Care Initiative, Rural Forward NC, the NC Budget & Tax Center, and the Louisiana Power Coalition for Equity and Justice.

New Equity Profiles

Continuing our work to inform equitable growth strategies locally, we developed equity profiles for Sacramento, Albuquerque, Cincinnati, and Omaha. As always, each profile was produced in partnership with local leaders who are using the data in their collective action efforts. In Albuquerque, the profile data will serve as a guide for the city’s Office of Equity and Inclusion as they develop their action agenda. In Cincinnati, the profile is informing the All-In Cincinnati coalition which is focusing on increasing housing affordability and stability for Black women in the city.

Other Reports and Publications

In April, we released Solving the Housing Crisis Is Key to Inclusive Prosperity in the Bay Area, produced in partnership with The San Francisco Foundation. Analyzing Zillow data on median rents, we found that two minimum-wage workers earning $15/hour can find affordable rentals in just 5 percent of the Bay Area’s 1,500 census tracts. Last month, in partnership with the Mastercard Center for Inclusive Growth, we released 100 Million and Counting: A Portrait of Economic Insecurity in the United States, which sheds new light on the 106 million Americans — nearly a third of the nation — who are living at or below 200 percent of the federal poverty level. Register here for an upcoming webinar on the report and its findings taking place on Monday, January 14, 12:00 - 1:00 pm PT / 3:00 - 4:00 pm ET.

Data in Action/Atlas in the News

Our team has also shared several blog posts adding equity data to the national dialogue about inclusive economies; those posts and our monthly email updates are archived here. And throughout the year, Atlas data and reports have also been covered by various local and national media outlets and articles, radio interviews, and more are available here.

Thank you once more for your interest in our work!

The National Equity Atlas team at PolicyLink and the USC Program for Environmental and Regional Equity (PERE)

Atlas Air Pollution Data Used in Sustainable Development Index


“Sustainable development is the enigmatic challenge of our time,” writes Jeffrey Sachs, Director of the Sustainable Development Solutions Network (SDSN) in the report Sustainable Development Report of the United States 2018 written in partnership with SDG USA. “Our global economy has created great wealth and technological wonders, but it has also created societies that are deeply divided between the haves and the have-nots, and economies that are destroying the natural environment and threatening humanity even as they spur economic growth.”

SDG USA is a think tank dedicated to researching and working towards sustainable development in the United States. This report is the first of an annual index which ranks the 50 states on progress toward the United Nations Sustainable Development Goals.

There are 17 Sustainable Development Goals used as the baseline for the state ranking system, including ensuring clean water and sanitation for all, building resilient infrastructure, and taking urgent action to combat climate change and its impacts. The report compiles the data from many sources, including the National Equity Atlas. Our data on unequal burden of air pollution was used for their Pollution Burden indicator as a measure of progress toward Sustainable Development Goal 10: Reduced inequalities. This indicator measures the difference between people of color’s population share and people of color’s exposure to cancer-causing pollutants. In 2015, New York State ranked highest in this pollution burden, while Montana ranked the lowest.

Read the report here. You can also explore and download the data on their interactive webpage.

National Equity Atlas Update

Dear Atlas Users,

Greetings from the National Equity Atlas team! We are busy at work crunching data for forthcoming analyses and tools that we will be rolled out in the next couple of months. In the meantime, we are happy to share news about our most recent equity profile release in Cincinnati.

Advancing Health Equity and Inclusive Growth in Cincinnati

On October 19, over 200 people gathered at the National Underground Railroad Freedom Center for the release event for the new equity profile; its accompanying policy brief, All-In Cincinnati: Equity is the Path to Inclusive Prosperity; and one-page fact sheet which were written in partnership with the Greater Cincinnati Foundation, United Way of Greater Cincinnati, and Interact for Health.

PolicyLink President and CEO Michael McAfee gave a keynote speech about how the city is poised to lead the nation on equity, and Senior Associate James Crowder presented data findings and potential policy solutions to the audience. These data and accompanying policy recommendations will help to inform the work of the All-In Cincinnati coalition. That coalition is using the PolicyLink All-In Cities policy framework as they move towards policy and systems change.

Local news station WCPO Cincinnati covered the report in a TV segment and accompanying article that highlight key data points that have informed the coalition to work towards removing barriers for women of color to participate more fully in, and benefit from the region's economy. Reporter Lucy May writes, "All-In Cincinnati's policy recommendations aim to help black women, who often feel the region's racial and economic inequities most acutely." Nick Swartsell from CityBeat also wrote about the release, lifting up, "the cascading effect economic and racial inequality have on Hamilton County residents."

Thank you!

The National Equity Atlas team at PolicyLink and the USC Program for Environmental and Regional Equity (PERE)

National Equity Atlas Update

Dear Atlas Users,

Happy fall! This month, the Atlas team hit the road, with presentations and equity profile community engagements from Orange County, California to Pinellas County, Florida and many more stops in between. In all of the places we are working, we are impressed by our community partners who are bringing together diverse leaders to effect policy changes to reduce racial and economic inequities.

#EquityData at Mile High Data Day

On September 20, about 180 Coloradan community leaders gathered for the third annual Mile High Data Day, held by Shift Research Lab, to gain new ideas, insights, and connections for using data to power their community change efforts. Sarah Treuhaft, managing director at PolicyLink, gave the keynote address, lifting up how the Equity Atlas team weaves story, data, and community partnerships together to drive equitable growth policy changes and sharing the Denver Renter Fact Sheet created in partnership with the Right to the City Alliance. At the conference, we were happy to learn that the Colorado Office of Health Equity used our data in its new Equity Action Guide.

Equity Profiles Underway for Long Beach, Orange County, and Pinellas County

We are busy gathering data and speaking with community leaders about key equitable growth challenges and opportunities in three very different coastal communities: the port city of Long Beach, California, located in Los Angeles County; Orange County, just to the east of Long Beach; and Pinellas County, Florida, home to St. Petersburg and Clearwater. The Long Beach profile will be released later this year with the others scheduled for release in early 2019.

Milwaukee Renter Data In Action

In July, the YWCA of Southeast Wisconsin requested a renter fact sheet to support its economic opportunity work. The data revealed that Milwaukee renters already spend $2.8 billion to the local economy every year, but could contribute an additional $352 million per year if six in 10 renters were not rent burdened. The YWCA has been using the data to make the case that better job opportunities and wage increases for disenfranchised communities of color would have broad benefits for the city, to push for quality homeownership opportunities for renters, and to counter the myth that renters are not concerned about their neighborhoods and do not contribute to the Milwaukee economy.

Atlas Team on the Road

The theme of this year's Community Indicators Consortium conference, held in Minneapolis, was "Community Indicators in Action" and we were happy to host a workshop on leveraging data and narrative to advance equity locally at the event. Sarah Treuhaft also delivered the Impact Award to the MAP Dashboard Project in Southern Arizona, whose data on teacher wages helped Tucson for Teachers win higher teacher pay as a part of the #RedforEd movement. This month, our team is looking forward to the EARN Conference in Chicago and the National Neighborhood Indicators meeting in Los Angeles.

The National Equity Atlas team at PolicyLink and the USC Program for Environmental and Regional Equity (PERE)

National Equity Atlas Update

Dear Atlas Users,

Greetings! As we move into fall, our team is expanding. We are happy to welcome Joanna Lee and Arpita Sharma to PERE, and are also excited for Huibin (Amee) Chew to join PolicyLink as an American Council of Learned Societies Equitable Economy Fellow, beginning September 4.
 

New Community Data Projects
Over the next year and a half, the National Equity Atlas team will be working with five community organizations and coalitions in New Mexico and Mississippi on data projects to advance equitable growth locally. The partners and their projects include: the New Mexico Center on Law and Poverty (predatory storefront lending), the New Mexico Worker Organizing Collaborative (wage theft), Doña Ana Communities United (equity policies in Las Cruces), San Juan College (equitable economic development in Farmington), and East Biloxi Community Collaborative (equitable opportunity zones). We are grateful to the W. K. Kellogg Foundation for supporting this project and excited to get started!

Join Us at the 2018 CIC Impact Summit in Minneapolis!
From September 17-19, the Community Indicators Consortium (CIC) will host its annual impact summit in Minneapolis, with the theme of "Community Indicators in Action." One of our longtime collaborators, Dr. Chris Benner of the University of California, Santa Cruz, will deliver the keynote, and Sarah Treuhaft will lead a workshop on leveraging data and narrative to advance equity locally on September 19. Register here.

Seeking a Communications Strategist in Oakland
Are you a communications expert passionate about racial and economic equity and empowering community changemakers with data? PolicyLink is looking for a part-time strategist in our Oakland office to implement our communications and outreach strategy for the National Equity Atlas and the forthcoming Bay Area Equity Atlas. Apply here.

In the News
Kevin Alin and Peter Truog of The Fund for Our Economic Future cited our data estimating that Cleveland's regional economy could be $15 billion stronger each year with racial equity in income in their blog post encouraging cities to advance racial equity through their opportunity zone investments.

Thank you!

The National Equity Atlas team at PolicyLink and the USC Program for Environmental and Regional Equity (PERE)

National Equity Atlas: July Update

Dear Atlas Users,

Greetings! July has been a month for making progress on a number of exciting projects we will roll out in the fall and winter. We are thrilled to welcome our newest team member, Michelle Huang, who has joined PolicyLink in our Oakland office. We also wish our teammate Ángel Ross well as they begin a doctorate program in sociology at UC Berkeley!
 

Seeking a Communications Strategist
Are you a communications expert passionate about racial and economic equity and empowering community changemakers with data? PolicyLink is looking for a part-time strategist in our Oakland office to implement our communications and outreach strategy for the National Equity Atlas and the forthcoming Bay Area Equity Atlas. Apply here.

Advancing the Conversation on Employment Equity
James Crowder recently participated in a radio interview with NC Policy Watch to describe the findings and recommendations of our report, "Advancing Employment Equity in Rural North Carolina." And he and Sarah Treuhaft penned an op-ed for the News & Observer lifting up the challenges posed by the proliferation of temporary employment in the state’s rural areas.

Charts of the Week: #EquityABQ and Health Equity in Michigan
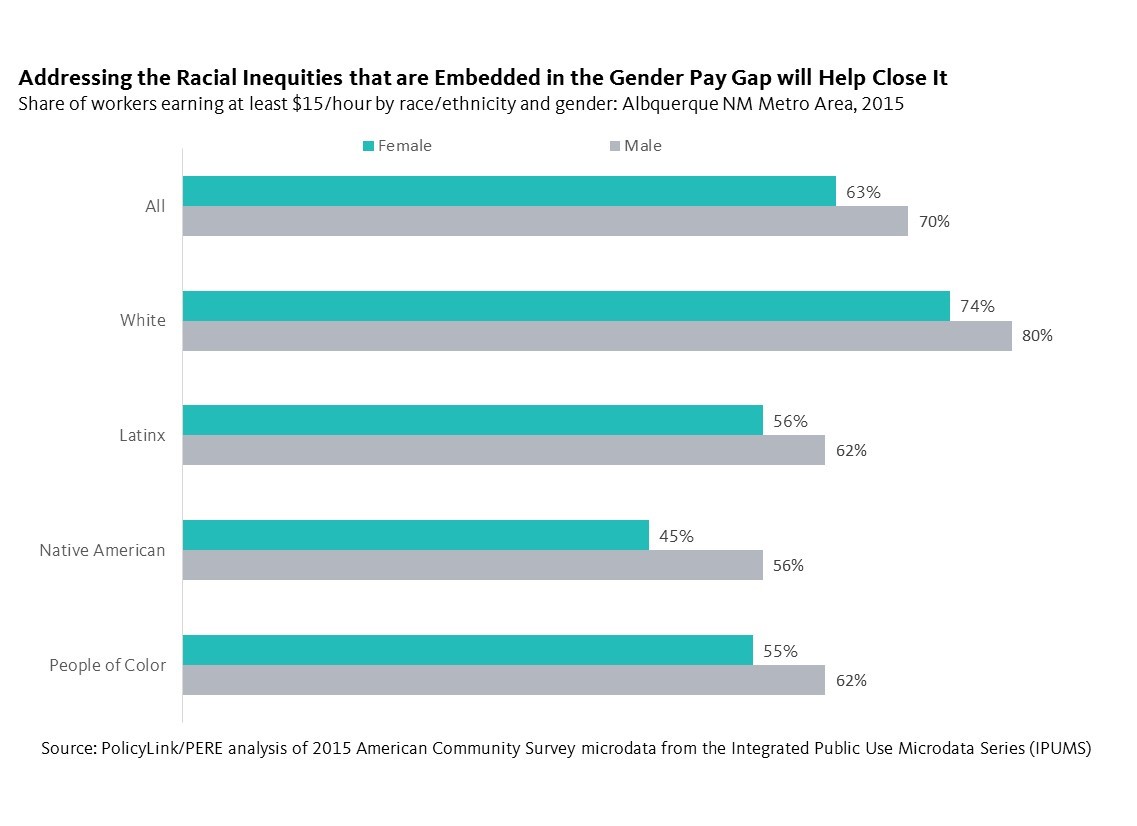
Following up on the Equity Profile of Albuquerque released last month, summer intern Maryjane Bermudez took a closer look at the gender wage gap in the Albuquerque metro, where just 45 percent of Native American women earn at least $15 per hour compared with 56 percent of Native American men and 80 percent of White men. Last week, Maryjane explored how the expansion of Michigan’s 10 cents a meal program could advance health equity.

Better Data for Better Health
We are honored to be among several tools featured in the Robert Wood Johnson Foundation's on its “Better Data for Better Health” web collection, which is also summarized in this handy brief. Check it out to explore other data tools for health equity!


In the News
As a part of the Bay Area Equity Atlas project, the Atlas team provided data to EBASE to incorporate into its report about the growing housing crisis in Concord, California. The data revealed how the majority of Concord renters have annual incomes below $50,000 yet in the vast majority of Concord neighborhoods, renters need an income of at least $75,000 to find affordable housing. Our data was included in articles about the report printed in the San Francisco Chronicle and The Mercury News.


Thank you!

The National Equity Atlas team at PolicyLink and the USC Program for Environmental and Regional Equity (PERE)

Chart of the Week: Michigan’s 10 Cents a Meal for School Kids & Farmers Program Promises to Boost Health Equity

To add equity data to the national dialogue about inclusive economies, the National Equity Atlas team regularly shares charts produced with data from the Atlas related to current events and issues. Join the conversation on social media using #equitydata.

Last month, Michigan Governor Rick Snyder signed a bill that expands the 10 Cents a Meal for School Kids & Farms program. The program, which began in 2016 and is endorsed by the Michigan Good Food Charter and supplements the Healthy, Hunger-Free Kids Act of 2010, provides participating school districts with up to 10 cents in match funding per meal to purchase and serve locally produced fruits, vegetables, and legumes. A 2016-2017 report on the program’s pilot found that it promoted both health and gave a boost the local economy: over $100,000 was spent on local produce from farms while school meals incorporated a wider range of fruits and vegetables. By the second year, the program introduced 95,000 students to 65 different types of healthy food options. 

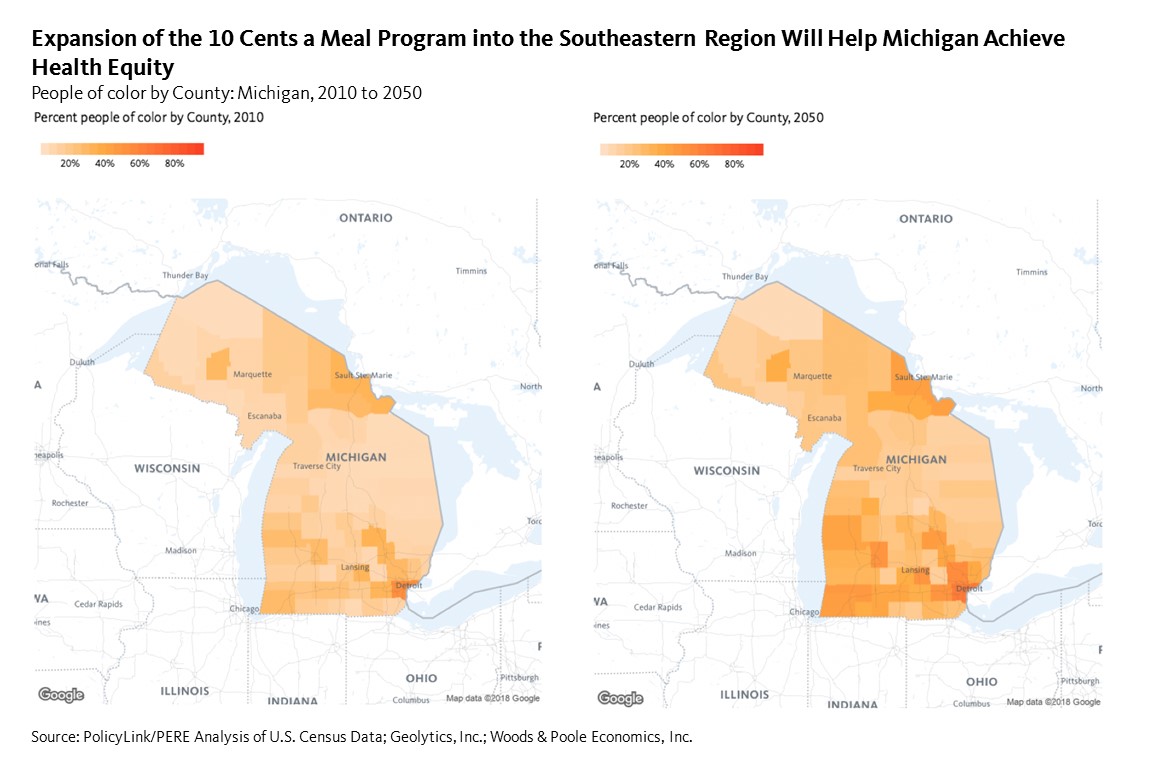
This week’s chart illustrates how the expansion of the 10 cents program will advance health equity by supporting the state’s youth and farmers, regardless of race or income. Initially serving Northwestern Michigan, the program expansion covers counties in the Southeastern region, including the cities of Flint, where 67 percent of youth of color are living under 150 percent of the poverty level, and Battle Creek, where Black, Latinx, and Mixed children are almost twice as likely as White children to live in poverty. The pilot program operated in Regions 2, 4, and 9 where the percentage of people of color is as low as five percent in Waxford County. The expansion will include Regions 6 and 8 where it will have the potential to serve more low-income, students of color. Importantly, the program does not include Wayne County (home to Detroit), where the population is over 50 percent people of color.

Studies show that when students are offered a healthier school lunch, they begin to adopt healthier eating behaviors. Children who are exposed to fresh produce early in life are likely to continue healthy eating patterns into adulthood and access to fruits and vegetables is a major component of preventing chronic health conditions like obesity.

The expansion of the program is one of many necessary solutions to ensure that all state residents can live a healthy life, regardless of racial identity or income. Across the country, advocates and organizations are seeking and developing strategies to ensure that students have access to local, healthy foods in and out of the classroom.  Michigan ranks 16th in percent of adults who are overweight or obese, and people of color are more likely to be obese compared to their white counterparts. Expansion into Southeastern Michigan will reach more youth of color and is an intervention to lower future rates of adulthood obesity. Addressing and eliminating the persistent health disparities among racial groups would further racial and ultimately economic equity.

To see how race is distributed by county in your state, visit the National Equity Atlas and type in your state. Download and share your map on social media using #equitydata.

Chart of the Week: Closing the Gender Wage Gap in Albuquerque Using an Equity Lens #EquityABQ

To add equity data to the national dialogue about inclusive economies, the National Equity Atlas team regularly shares charts produced with data from the Atlas related to current events and issues. Join the conversation on social media using #equitydata.

Last month, with support from the W.K. Kellogg Foundation and in partnership with the City of Albuquerque and New Mexico Voices for Children, we released an equitable growth profile of Albuquerque showing that the region’s GDP would increase by almost $11 billion if there were no racial disparities in income. The profile will serve as a guiding document for the city’s restructured Office of Equity and Inclusion, which has revitalized the city’s commitment to racial and economic equity through actionable goals that address the issues head on.  Albuquerque’s Pay Equity Initiative, for example, requires businesses interested in contracting with the City to report their pay scales by gender and job category, with preference given to businesses whose pay scales are more equitable. The policy addresses one aspect of the gender pay gap by contracting with entities that ensure employees, regardless of gender identity, are paid equally.

This week’s chart highlights the gender wage gap in the Albuquerque metropolitan region by exploring the share of workers, disaggregated by race and gender, who earn at least $15/hour. To fully address the gender pay gap, it is imperative to acknowledge the racial inequities that exist across gender. One important caveat to this analysis: the Atlas datasets are drawn from national surveys like the American Community Survey, which only offers two gender options — female and male — effectively excluding the experiences of people who do not identify within the gender binary.

Among all racial groups, men are more likely than women to earn at least $15/hour. Among women, three quarters of White women earn at least $15/hour yet only 56 percent of Latinx women and less than half of Native American women reach the $15/hour threshold. White women still earn more than people of color, regardless of gender identity. Overall, White men are 1.5 times more likely to earn $15/hour compared to women of color. This phenomenon is not limited to the Albuquerque metropolitan region. In the United States, 56 percent of women of color earn $15/hour, compared to 80 percent of White men.

Latinx and Native American people make up over half of the population in the Albuquerque metropolitan region and experience the highest rates of poverty. To afford basic necessities in Albuquerque, a single adult with one child would need to make at least $25/hour. An hourly wage of less than $15 keeps individuals and families economically insecure, and families of color are more at risk. Economic insecurity can lead to worse health outcomes and stunts an entire region’s economic growth, as illustrated by the recent equity profile. Another report found that if women received equal pay, the United States’ GDP would increase by $513 billion. To further extend pay equity, Albuquerque can look to the city of Philadelphia who extends its equitable contracting policies to focus on businesses owned by people of color and people with disabilities, in addition to women.

To see how the gender pay gap varies in your community in addition to solutions and strategies, visit the National Equity Atlas and type in your city, state, or metropolitan region. Download and share the chart on social media using #equitydata.

National Equity Atlas: June Update

Dear Atlas Users,

Happy summer! June was a busy month for our team with new reports released with partners in Omaha, Albuquerque, and North Carolina. And we were thrilled to see our data on the potential economic benefits gained by eliminating the rent burden used to power advocacy in New Orleans and Louisiana!

Equity Atlas Renter Data Helps Secure Policy Wins in Louisiana
Timely, local data can strengthen advocacy, as we saw last month when the Greater New Orleans Housing Alliance (GNOHA) used our “When Renters Rise, Cities Thrive” fact sheets to help secure two policy wins. GNOHA used the New Orleans data to advocate in support of a temporary ban on short-term rentals to halt the loss of affordable homes. And they used the Louisiana data to advocate against a state preemption bill that would have banned local governments from adopting inclusionary zoning policies. Gambit Weekly and Biz New Orleans wrote about the new data. Read more here and contact us if you would like a similar fact sheet for your city or state.

Equity in the Heartland: Updated Omaha Equity Profile
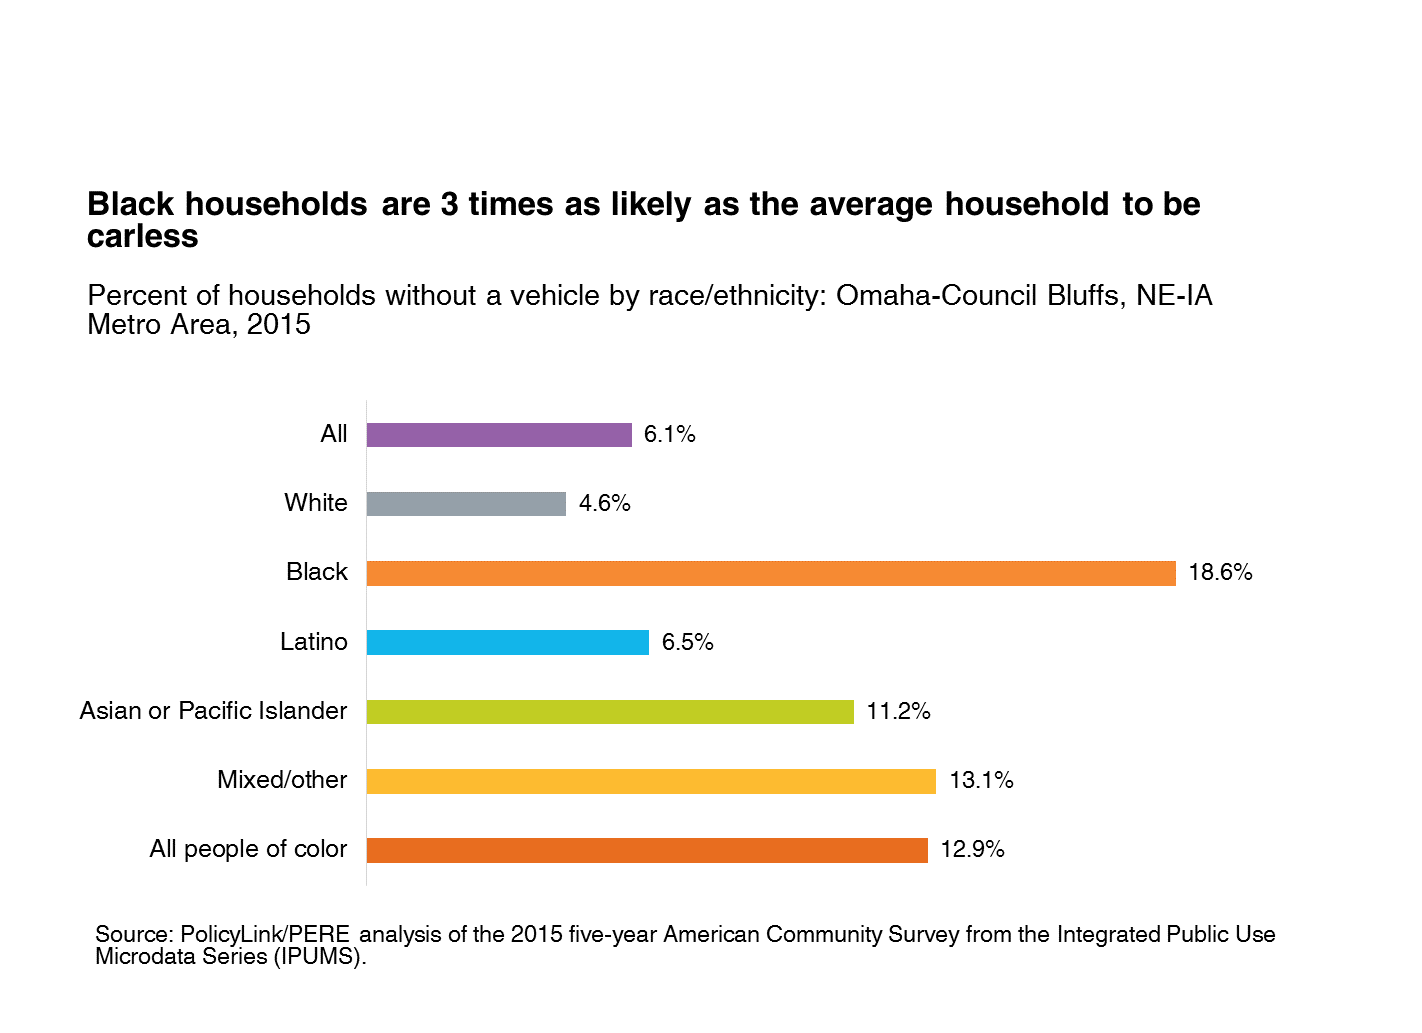
On June 6, the National Equity Atlas team, in partnership with Heartland 2050, released an updated equitable growth profile of the Omaha-Council Bluffs region at “Everyone Prospers: The Path to Equity,” a gathering hosted by the United Way of the Midlands and the Metropolitan Area Planning Agency. Car access stood out as a challenge to economic opportunity in the region, with Black households three times as likely to be carless as the average household, as Jamila Henderson writes in this Chart of the Week.

Toward One Albuquerque
We also released an equity profile of the City of Albuquerque (along with this summary) at an event jointly held by Mayor Tim Keller and community partners including New Mexico Voices for Children. The equity profile data will serve as a guide for the city’s Office of Equity and Inclusion as they develop their action agenda. The mayor tweeted: “We’re taking action to close these gaps to create an economy that works for everyone.” The event was covered by the Albuquerque Journal and TV news station KRQE.

New Report: Advancing Employment Equity in Rural North Carolina
Our last release of the month took place in Raleigh, where we joined our partners at Rural Forward NC and the NC Budget and Tax Policy Center to share our analysis of how much stronger the state economy would be with employment equity in its rural areas. One of the challenges repeatedly brought up by focus group participants in three rural towns was the replacement of regular jobs with temporary jobs that offer lower pay and benefits for the same work. Leaders from the state’s workforce development and community college system, as well as other anchor institutions, discussed potential policy solutions at the release event. Read the report and fact sheet.

Join Our Team: Seeking a Senior Associate in the PolicyLink Oakland Office
Are you a data geek passionate about racial and economic equity and empowering community changemakers? Or, do you know someone who is? PolicyLink is seeking a senior associate to join the National Equity Atlas team and manage a project supporting community partners to develop equity data tools. Apply or share with your networks and on social media.

New #EquityData Resources
The W.K. Kellogg Foundation and Altarum released a national study, The Business Case for Equity: A Strategy for Growth, estimating that closing long-standing racial inequities in health, education, employment, and incarceration would boost the nation's economy by $8 trillion by 2050. Companion reports are also available for Mississippi, New Mexico, and New Orleans. Also, the newly launched City Health Dashboard provides data on 36 measures of health for the 500 largest U.S. cities, and includes data disaggregated by race/ethnicity for absenteeism, high school graduation, low birthweight, prenatal care, and more. Both items (and much more!) can be found on this Resources page on the Atlas.

Thank you!

The National Equity Atlas team at PolicyLink and the USC Program for Environmental and Regional Equity (PERE)

Chart of the Week: Mayor De Blasio’s New Specialized High School Admission Policy is a Step Toward Educational Equity

To add equity data to the national dialogue about inclusive economies, the National Equity Atlas team regularly shares charts produced with data from the Atlas related to current events and issues. Join the conversation on social media using #equitydata.

Earlier this month, New York City Mayor Bill de Blasio announced a plan to phase out the Specialized High Schools Admissions Test in an effort to increase access to the city’s highest performing public high schools for low-income students who are disproportionately underrepresented students of color. Instead of the high-stakes standardized test, where test preparation is not offered in public elementary or middle schools, students will be admitted based on their academic achievements. The proposal addresses persistent racial disparities: Latinx and Black students make up 70 percent of the city’s public-school population, but only 10 percent of students at the eight specialized high schools. The administration expects that after the policy is fully enacted, admission offers to Latinx and Black students will increase from 9 percent to 45 percent of total offers.

But with more than 400 high schools in the district serving over 240,000 students, increasing accessibility to these elite high schools is only the first step toward achieving an equitable public-school system. This week’s chart highlights the pervasive racial and economic segregation of public high schools in New York City, using the percentage of students who qualify for the free and reduced-price school lunch program as a measure of “school poverty.”

Research indicates that students who attend high poverty schools, regardless of family socioeconomic status, fare worse than students attending low poverty schools. In New York City, nearly half of Latinx, Black, and Native American high school students attend high poverty schools where more than 75 percent of students are low-income, compared with just 16 percent of White students. Students of color in New York City, overall, are nearly three times as likely as their White counterparts to attend a high poverty high school.

Three quarters of New York City’s youth are people of color: for the city to thrive, these youth must be able to access a high-quality education that prepares them for college and the workforce. Yet they are disproportionately stuck in segregated, inadequately funded schools. To build a strong workforce for the future, and deliver on the promise of education for all, New York City should adopt strong policies to ensure equitable school funding, prioritize training, hiring, and retaining highly qualified teachers for hard-to-staff schools, and implement local measures to increase school integration. The city can take its cue from California, where implementation of an equitable school funding policy in 2013 has led to improvements in graduation rates and academic achievement for Latinx, Black, and low-income students.

To see how school poverty varies in your community in addition to solutions and strategies, visit the National Equity Atlas and type in your city or state.

Chart of the Week: Transportation Equity is Key to Inclusive Prosperity in the Omaha Region

To add equity data to the national dialogue about inclusive economies, the National Equity Atlas team regularly shares charts produced with data from the Atlas related to current events and issues. Join the conversation on social media using #equitydata.

On June 6, the National Equity Atlas team (and Heartland 2050) released an updated equitable growth profile of the Omaha-Council Bluffs region at “Everyone Prospers: The Path to Equity,” a gathering hosted by the United Way of the Midlands and the Metropolitan Area Planning Agency. In reviewing the data, one of the indicators that stood out as a major challenge to economic opportunity in the region was car ownership.

Reliable and affordable transportation is critical for meeting daily needs and accessing educational and employment opportunities. For households living in regions without robust transit systems, access to a car is critical, but lower-income people, people of color, and some immigrant communities are more likely to be carless.

In the Omaha-Council Bluffs region, spanning 8 counties in Nebraska and Iowa, most households—94 percent—have at least one car (or truck or van). This is similar to other Midwestern metros like Kansas City and Des Moines (see this ranking chart). But there are wide differences by race: Black households are 3 times as likely as the average household to be carless. Furthermore, the Black community is geographically concentrated in the neighborhood of North Omaha where there are fewer employment opportunities and limited transit options.

Living outside major job centers with limited transportation options puts these households at a unique disadvantage, especially given that 93 percent of work trips in the region occur by private vehicle. This is according to the region’s Long Range Transportation Plan (which covers the 3 most populous counties in the 8-county Omaha-Council Bluffs Region).

This phenomenon is not unique to Omaha-Council Bluffs. The share of Black households without a car stands at 20 percent for the nation, slightly higher than in Omaha Council-Bluffs (19 percent). Looking at the share of Black households without a car in Omaha-Council Bluffs and over a dozen neighboring regions, Omaha-Council Bluffs falls somewhere near the middle, faring better than some communities (27 percent of Black households are carless in the Minneapolis-St. Paul metro area) and worse than others (15 percent of Black households are carless in the Des Moines metro area).

We also see disparities in car ownership for other communities in Omaha-Council Bluffs. Looking at immigrant and U.S.-born households, the biggest disparity is among White residents: 10 percent of White immigrant households are carless compared with only 5 percent of White U.S-born households.

Bus rapid transit is one strategy to better connect residents to opportunities, and other regions such as the Cleveland metro area, have seen success. In 2008, the city launched its bus rapid transit system, successfully linking the high unemployment, predominantly Black city of East Cleveland to the region’s two largest job centers. To learn more, click here.

To see how car access varies in your community, visit the National Equity Atlas and type in your city or state. Download and share the chart on social media using #equitydata.

Equity Atlas Rent Burden Data Helps Secure Double Policy Wins in Louisiana


Our goal is to put timely local data in the hands of advocates working to make the case for inclusive prosperity in their communities. So we were thrilled to learn that last month, the Greater New Orleans Housing Alliance (GNOHA) used data from our “When Renters Rise, Cities Thrive” analysis to secure policy wins at both the state and local level.

The analysis of New Orleans shows that renters make up the majority of the city’s residents, but 60 percent of them are rent burdened, meaning they pay more than 30 percent of their income on housing costs. If no renters paid more than they could afford on housing in the city, they would see an average increase of $7,200 per household each year.

Last month, the New Orleans City Council addressed one piece of the housing affordability puzzle by banning new entire-home short-term rentals in residential neighborhoods. GNOHA used the fact sheets to advocate in support of the temporary ban (officially called an interim zoning district), highlighting the severity of the rental affordability crisis and the economic benefits of reducing rent burdens across the city.

As Andreanecia Morris, president and Chairwoman of GNOHA, explained to Gambit:

“We are at an important crossroads. We can choose to stabilize our citizens, allow them to contribute to the local economy and change the course of New Orleans’ next 300 years, or we can allow this trend to continue and undoubtedly force more of our people out of the city they call home.”

Meanwhile in Baton Rouge, GNOHA used the same data points for Louisiana to advocate against a state preemption bill (Senate Bill 462) that would have banned local governments from adopting inclusionary zoning policies. The law was an attack on the growing movement to codify New Orleans’ Smart Housing Mix Ordinance, and would have made affordable housing policies voluntary rather than mandated as recommended by the New Orleans’ City Planning Commission and City Council.

Our data shows that renters now make up one in three Louisiana residents, but more than half pay too much for housing. If no renters were housing burdened, they would collectively have an additional $1.5 billion dollars to spend in their communities every year. GNOHA’s arguments did not convince the legislature, which passed the bill. But Governor John Bel Edwards, in response to the tireless advocacy of GNOHA and other local organizations, vetoed the bill last Saturday.

View all of the publicly available fact sheets here

National Equity Atlas: May Update

We hope you enjoyed the long weekend! Our team has been on the road a lot this month, working with partners on the ground in Louisiana, Mississippi, New York, and North Carolina in addition to the Bay Area and Long Beach, and presenting on the Atlas at the National League of Cities in DC. We have also been busy getting ready for some upcoming report releases and crunching data for forthcoming analyses and tools. And we were happy to welcome Sabrina Kim to our team as a data analyst at PERE.

  • Join Our Team: Seeking a Senior Associate in the PolicyLink Oakland Office
    Are you a data geek passionate about racial and economic equity and empowering community changemakers with data? PolicyLink is seeking a senior associate in their Oakland office to join the National Equity Atlas team and manage a project supporting community partners to develop equity data tools. Apply here.


  • The Case for Employment Equity in Mississippi
    Last week we were in Jackson for the release of our new report produced in partnership with the Mississippi Low-Income Child Care Initiative. We found that the state economy could be $2.5 billion stronger each year if unemployment was 4 percent or less for all gender and racial groups and more workers were brought into the labor force. At the event, our partners highlighted how increased funding for child care and more career pathways into good, "middle-skills" jobs for women of color would improve opportunities for those women, their communities, and the state economy. Read Boosting Economic Growth in Mississippi through Employment Equity here.


  • Designing Local Health Equity Atlases in Louisiana and Buffalo
    Earlier this month, we traveled to Louisiana and Buffalo, to facilitate data design sessions with local partners to inform the development of local health equity atlases. In Louisiana, we are working with the Power Coalition for Equity and Justice to develop an online data tool that informs and mobilizes voters across the state. In New Orleans, the Greater New Orleans Housing Alliance is already using data from our renter fact sheets to advocate for renter protections locally and against a state preemption bill. In Buffalo, we are working with Open Buffalo to develop a tool that democratizes data and builds a better understanding of housing, poverty, and transit access as health issues.


  • Chart of the Week: #APAHeritageMonth
    In honor of Asian/Pacific American Heritage month, Jamila Henderson wrote about differences in educational attainment among the Asian and Pacific Islander (API) community in the Los Angeles metro area, where 62 percent of all API working-age adults have at least an Associate's degree, but only 21 percent of those are of Samoan ancestry and 27 percent of those with Cambodian ancestry. In another chart of the week Sarah Treuhaft, highlighted how renter spending power in the Bay Area would increase by $4.4 billion if no renters paid more than 30 percent of their income on housing cost.


Thank you!

The National Equity Atlas team at PolicyLink and the USC Program for Environmental and Regional Equity (PERE)

We're Hiring a Senior Associate, Equitable Economy/National Equity Atlas


PolicyLink is seeking a full-time Senior Associate to join the Equitable Economy team and the formal research partnership with the Program for Environmental and Regional Equity (PERE) at the University of Southern California. The ideal candidate is passionate about producing data and research that is relevant and actionable for those working on the frontlines to advance racial economic equity. 

To learn more about the position visit, careers

Pages