FoodLab Detroit Uses Equity Data to Power Its Good Food, Good Jobs Strategy

FoodLab Detroit is a community of food entrepreneurs designing, building, and maintaining a diverse ecosystem of triple-bottom-line food businesses as part of a good food movement that is accountable to all Detroiters.

At their recent Annual Network Gathering, designers, policy experts, food justice activists, FoodLab member businesses and community leaders were invited to brainstorm about how to solve the problem of economic inequality and the rise of the working poor in Detroit by ensuring that good food and good jobs are accessible to all people.

At the beginning of the gathering, Chris Schildt from PolicyLink presented the recently-published Detroit equity profile and key metrics related to the city's demographics, economic vitality, workforce readiness, connectedness and economic benefits. Specifically, that:

  • Poverty rates, including rates of working poverty, are growing throughout the city. 64 percent of residents in 2014 lived living below 200 percent of the poverty level.
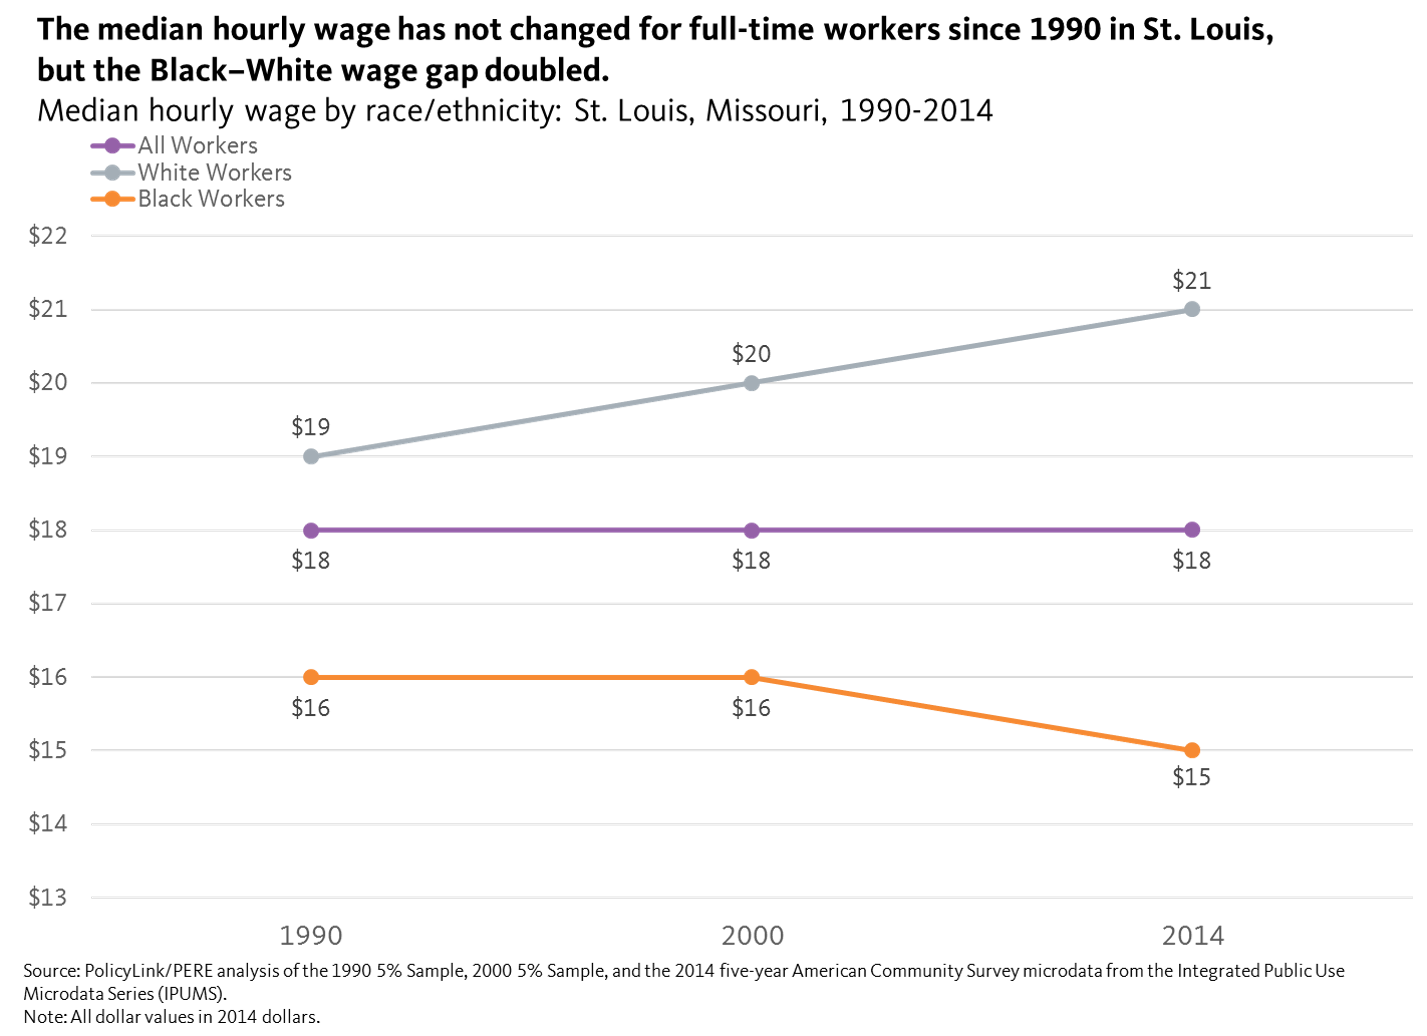
  • People of color continue to earn the lowest wages. Since 2000, white workers have seen an average decrease in wages by $2/hour, whereas non-white workers (including black and Latino) have seen an average decrease in wages by $5/hour.
  • Roughly 30,000 youth (95 percent of which are people of color) are disconnected from work or school. Detroit is the city with the largest share of disconnected youth in the United States.
  • The average income for people of color in Detroit would increase by 25 percent with racial equity.


In their recap of the event, organizers write, “Armed with this data, we discussed how to build a new economy in Detroit that is equitable, sustainable, prosperous and provides opportunities to restore power and agency back to those communities most marginalized.”

FoodLab Detroit documented the gathering in the photo essay, “Food as a Catalyst for Community Change.”

They have also created a three-part photo essay series about their Good Food, Good Jobs strategy, in which food entrepreneurs are creating an inclusive food economy that empowers individuals and supports their community's vision for a vibrant, thriving economy:

National Equity Atlas Update

Dear Atlas Users,

We hope you are enjoying the end of summer! We had a busy month with the release of five new equity profiles, a national convening on how to design equity data tools for community action, and the release of the All-In Cities Policy Toolkit.

New Equity Profiles Released for Five Communities
Understanding the state of equity in your community is a crucial first step to developing equitable growth strategies, but such comprehensive assessments are rare, especially for smaller communities. With support from the W.K. Kellogg Foundation, the National Equity Atlas team recently released equity profiles for five smaller communities: Las Cruces and Farmington, New Mexico; Biloxi and Sunflower County, Mississippi; and Battle Creek, Michigan. During our June 29 webinar, Jessica Pizarek and James Crowder of PolicyLink shared key findings with the field and local leaders from the five communities described how they would use the data to advance equity efforts.

Powering Health Equity Action with Online Data Tools Convening
On July 10, the National Equity Atlas team and Ecotrust hosted a convening in Portland focused on how data tools like the Atlas can power community action towards health equity. About 40 researchers, advocates, data users, and funders shared learnings and workshopped a set of design principles for online data tools for health equity. One of the panels featured Nathaniel Smith from the Partnership for Southern Equity, Sam Sinyangwe from Campaign Zero/Mapping Police Violence, Julia Sebastian from Race Forward, Cat Goughnour from Prosperity Now, and Antwi Akom from Streetwyze, ISEEED, and the Social Innovation and Urban Opportunity Lab at the University of California, San Franiciso and San Francisco State University. Watch that panel discussion here and look out for a final report on the convening and design principles in the fall.

Chart of the Week: Rollback of St. Louis Minimum Wage Hike Drags Down Missouri Economy
Come August 28, St. Louis’s minimum wage will drop from $10/hour to $7.70/hour, thanks to a new Missouri law that prevents municipalities from enacting higher minimum wages than the state standard. This shortsighted policy harms workers and ultimately the state’s economy since lower wages translate into less spending and higher levels of public assistance for the working poor. It also hinders sorely needed progress toward racial equity, as illustrated by our chart of the week. In St. Louis, median hourly wages for full-time workers has remained $18/hour since 1990, while the wage gap between Black and White workers has doubled. To be the first to view each week's chart, follow @PolicyLink on Twitter and visit the Data in Action section of the National Equity Atlas.

New Resource: All-In Cities Policy Toolkit
Interested in learning more about policy solutions to advance racial inclusion and equitable growth? Check out the new All-In Cities Policy Toolkit released July 13. It provides more information on many of the policy strategies shared on the Atlas including living wage provisions, local and targeted hiring, summer youth employment, housing trust funds, racial equity impact assessments, and more. Click here to view the toolkit launch webinar with a demo on how to navigate the site, and stay tuned for new content!

New Study Shows Less Income Inequality = Greater Economic Resilience
A new article in Regional Studies, by three economists at the University of Idaho exploring the relationship between income equality and economic resilience, found that the risk of recession was lower for more equitable counties during the Great Recession. Why was this the case? Because higher-income households are less likely to spend money locally than lower-income households and because growing consumer debt makes the middle-class more vulnerable. Check out this overview in CityLab, and find this and other resources to make the economic case for equity on the Atlas.

Thank you!

The National Equity Atlas team at PolicyLink and the USC Program for Environmental and Regional Equity (PERE)

Chart of the Week: Missouri Rolls Back St. Louis Minimum Wage Hike

To add equity data to the national dialogue about growth and prosperity, every week the National Equity Atlas team posts a new chart from the Equity Atlas related to current events and issues.

Today, minimum-wage workers in St. Louis make $10/hour. This is only after a two-year battle in the courts in which the Missouri Supreme Court ultimately upheld the City of St. Louis’s authority to raise its minimum wage following a suit brought by business owners against a 2015 city ordinance. But come August 28, their wages will drop to $7.70/hour thanks to the state government – costing the average full-time, minimum-wage worker in St. Louis about $4,600 per year in lost pay.

Income inequality in the city was higher than the nation in 1990 and has only increased since. Rising inequality does not only hurt low- and middle-wage workers; it also acts as a drag on economic growth for the whole region. More equitable economies, on the other hand, are more resilient and experience more sustained economic growth. Still, Missouri Governor Eric Greitens claimed, without evidence, that the city ordinance “will take money out of people’s pockets,” while allowing a bill that will literally take money out of worker’s paychecks to become law. As State Senator Jamilah Nasheed, whose district includes St. Louis, points out: “Missouri taxpayers shell out $2.4 billion per year in public assistance to make up for the fact that big companies like McDonald’s and Walmart don’t pay their workers enough to survive. Governor [Eric] Greitens and Republican legislators in Jefferson City may be content to let taxpayers subsidize poverty [to] pay for big business, but St. Louis is choosing a different path. One way or another, we are going to save this raise.”

This week’s chart shows how even though there has been no real increase in the median hourly wage since 1990, the Black-White wage gap as doubled. While the median wage captures workers in the middle of the wage distribution, research has shown that minimum wage increases produce “ripple effects” or increases in those earning above the minimum wage. More importantly, a living wage for a family consisting of one adult and one child in St. Louis is over $20/hour, but the median wage has remained $18/hour since 1990. At the same time, the Black-White wage gap has doubled. White workers experienced a $2/hour increase in median wages from 1990 to 2014 while the Black median wage declined $1/hour. Despite stagnant wage growth among all workers, the state of Missouri is still working to suppress wages for low-wage workers.

In an equitable city and state, wages would reflect differences in education, training, experience, as well as pay scales across occupations and industries, but would not vary systematically by race or gender. But National Equity Atlas data shows that full-time White workers have a higher median wage than Black workers in St. Louis and Missouri at nearly every education level. Importantly, this law will hurt all low-wage workers throughout the state, taking hard-earned money of out people’s paychecks in order to deepen the pockets of large businesses.

To see how median wages have changed in your city or state, visit the National Equity Atlas and type in your city or state. Download and share the chart on social media using #equitydata.

National Equity Atlas Update

June 27, 2017

Dear Atlas User,

Summer is here, and the demand for data to drive community action for health equity and inclusive growth continues to grow! We are busy preparing for two important events: the release of five new equity profiles for smaller communities and a national conversation about data tools for health equity action in Portland. We were also thrilled to see our data on working poverty used in an op-ed for Teen Vogue refuting HUD Secretary Ben Carson's claim that poverty is "a state of mind."

July 10 Webcast: Data Tools for Health Equity Action

Join us on July 10 at 11 a.m. PDT/2 p.m. EDT for a livestreamed panel discussion in Portland with national leaders who are using and designing data tools to drive health equity action. Speakers include Nathaniel Smith from the Partnership for Southern Equity, Sam Sinyangwe from Campaign Zero and Mapping Police Violence, Julia Sebastian from Race Forward, Cat Goughnour from Radix Consulting and Right 2 Root, and Antwi Akom from Streetwyze, ISEEED, and the Social Innovation and Urban Opportunity Lab at UCSF and SFS. PolicyLink Senior Director Sarah Treuhaft will moderate. The event is co-hosted by PolicyLink and Ecotrust and generously supported by the Robert Wood Johnson Foundation. REGISTER NOW.

June 29 Webinar: Disaggregated Data for Equitable Growth in Smaller Cities

On Thursday, June 29 (11 a.m. PDT/2 p.m. EDT), the Equity Atlas team is holding a webinar highlighting the release of new equity data profiles for five smaller communities: Las Cruces and Farmington, New Mexico; Biloxi and Sunflower County, Mississippi; and Battle Creek, Michigan. Local community leaders, including Rodolfo Acosta-Perez from the Community Action Agency of Southern New Mexico, Josh Davis, Delta Health Alliance, Allytra Perryman of the East Biloxi Community Collaborative, and Jorge Zeballos, Center for Diversity and Innovation at Kellogg Community College, will share how they plan to use the data to advance their work. These profiles were developed with support from the W.K. Kellogg Foundation. Register here.

New Detroit Equity Profile

After decades of job and population loss, the City of Detroit has shown recent signs of growth, yet deep racial inequities, declining wages, and a hollowing out of middle-wage, high-opportunity jobs threaten the city's rebound and economic viability. Developed with the support of the W.K. Kellogg Foundation, this new equity profile highlights how pursuing equitable growth can benefit all residents and businesses in Detroit. For example, had racial inequities in income been eliminated in 2014, the Detroit region's GDP could have been $29 billion larger, a 13 percent increase. We released this profile at a gathering of community leaders on June 13 and also presented our findings at the Allied Media Conference Good Food Good Jobs Network Gathering hosted by FoodLab Detroit.

Chart of the Week is Back!

After a brief hiatus, the Atlas Chart of the Week is back! This week's chart #ProtectMedicaid shows the states with the highest share of people living below 150 percent of the federal poverty line, highlighting those who have expanded Medicaid. To be the first to view each week's chart, follow @PolicyLink on Twitter and visit the Data in Action section of the National Equity Atlas.

In the News…

  • In a recent op-ed for Teen Vogue, writer Lincoln Blades shares our data on working poverty to dispute the perception that poverty is a mindset, responding to HUD Secretary Ben Carson's comment, "I think poverty to a large extent is also a state of mind."
  • The Long Island Equity Profile released April 24 continues to gain traction. As reported by Newsday, Theresa Sanders of the Long Island Urban League presented the findings to the Long Island Regional Planning Council, the Long Island economy could be $24 billion stronger with racial equity. The council's chair found that statistic "startling" and sought solutions to advance equitable growth in the region.


Thank you!

The National Equity Atlas team at PolicyLink and the USC Program for Environmental and Regional Equity (PERE)

Chart of the Week: #ProtectMedicaid

To add equity data to the national dialogue about growth and prosperity, every week the National Equity Atlas team posts a new chart from the Equity Atlas related to current events and issues.

Last week, Senate Republicans unveiled their health care bill to repeal and replace the Affordable Care Act (ACA). Like the ACA, the House and Senate bills provide health insurance subsidies through tax credits. But they also roll back federal money to states that opt-in to the Medicaid expansion through the ACA and end Medicaid as an open-ended entitlement.

This week’s chart highlights the share of people living below 150 percent of the federal poverty level (FPL) and the states that have expanded Medicaid coverage. For states that have expanded coverage, individuals in a household with an income below 138 percent of the FPL are eligible for Medicaid. As the chart below shows, among the five states with the highest share of people of color below 150 percent of the FPL, only Arkansas and Montana have elected to expand Medicaid. The two states with the highest share of people of color below 150 percent of the FPL —South Dakota and Mississippi, where more than half of people of color live below this poverty threshold — have not expanded Medicaid. At the same time, the three states with the highest share of White people below 150 percent of the FPL — West Virginia, Kentucky, and Arkansas — have expanded Medicaid.

As the Senate prepares to bring the health care bill to the floor this week, call your Senators at (202) 224-3121 to encourage them to save Medicaid, which insures nearly one in five Americans.  

To see how poverty varies in your city, region, or state, visit the National Equity Atlas and share the chart of your community using #ProtectMedicaid and #equitydata.

Pages