Chart of the Week: Vote for Candidates Who Will Invest in our Future
To add equity data to the national dialogue about growth and prosperity, every week the National Equity Atlas team posts a new chart from the Equity Atlas related to current events and issues.
News stories about broad demographic shifts and the changing face of America are increasingly common. Last year, California — the most populous state in the nation — became the fourth “majority-minority” state. Already the majority of youth under age 5 nationwide are people of color, and by 2044, the nation will be majority people of color.
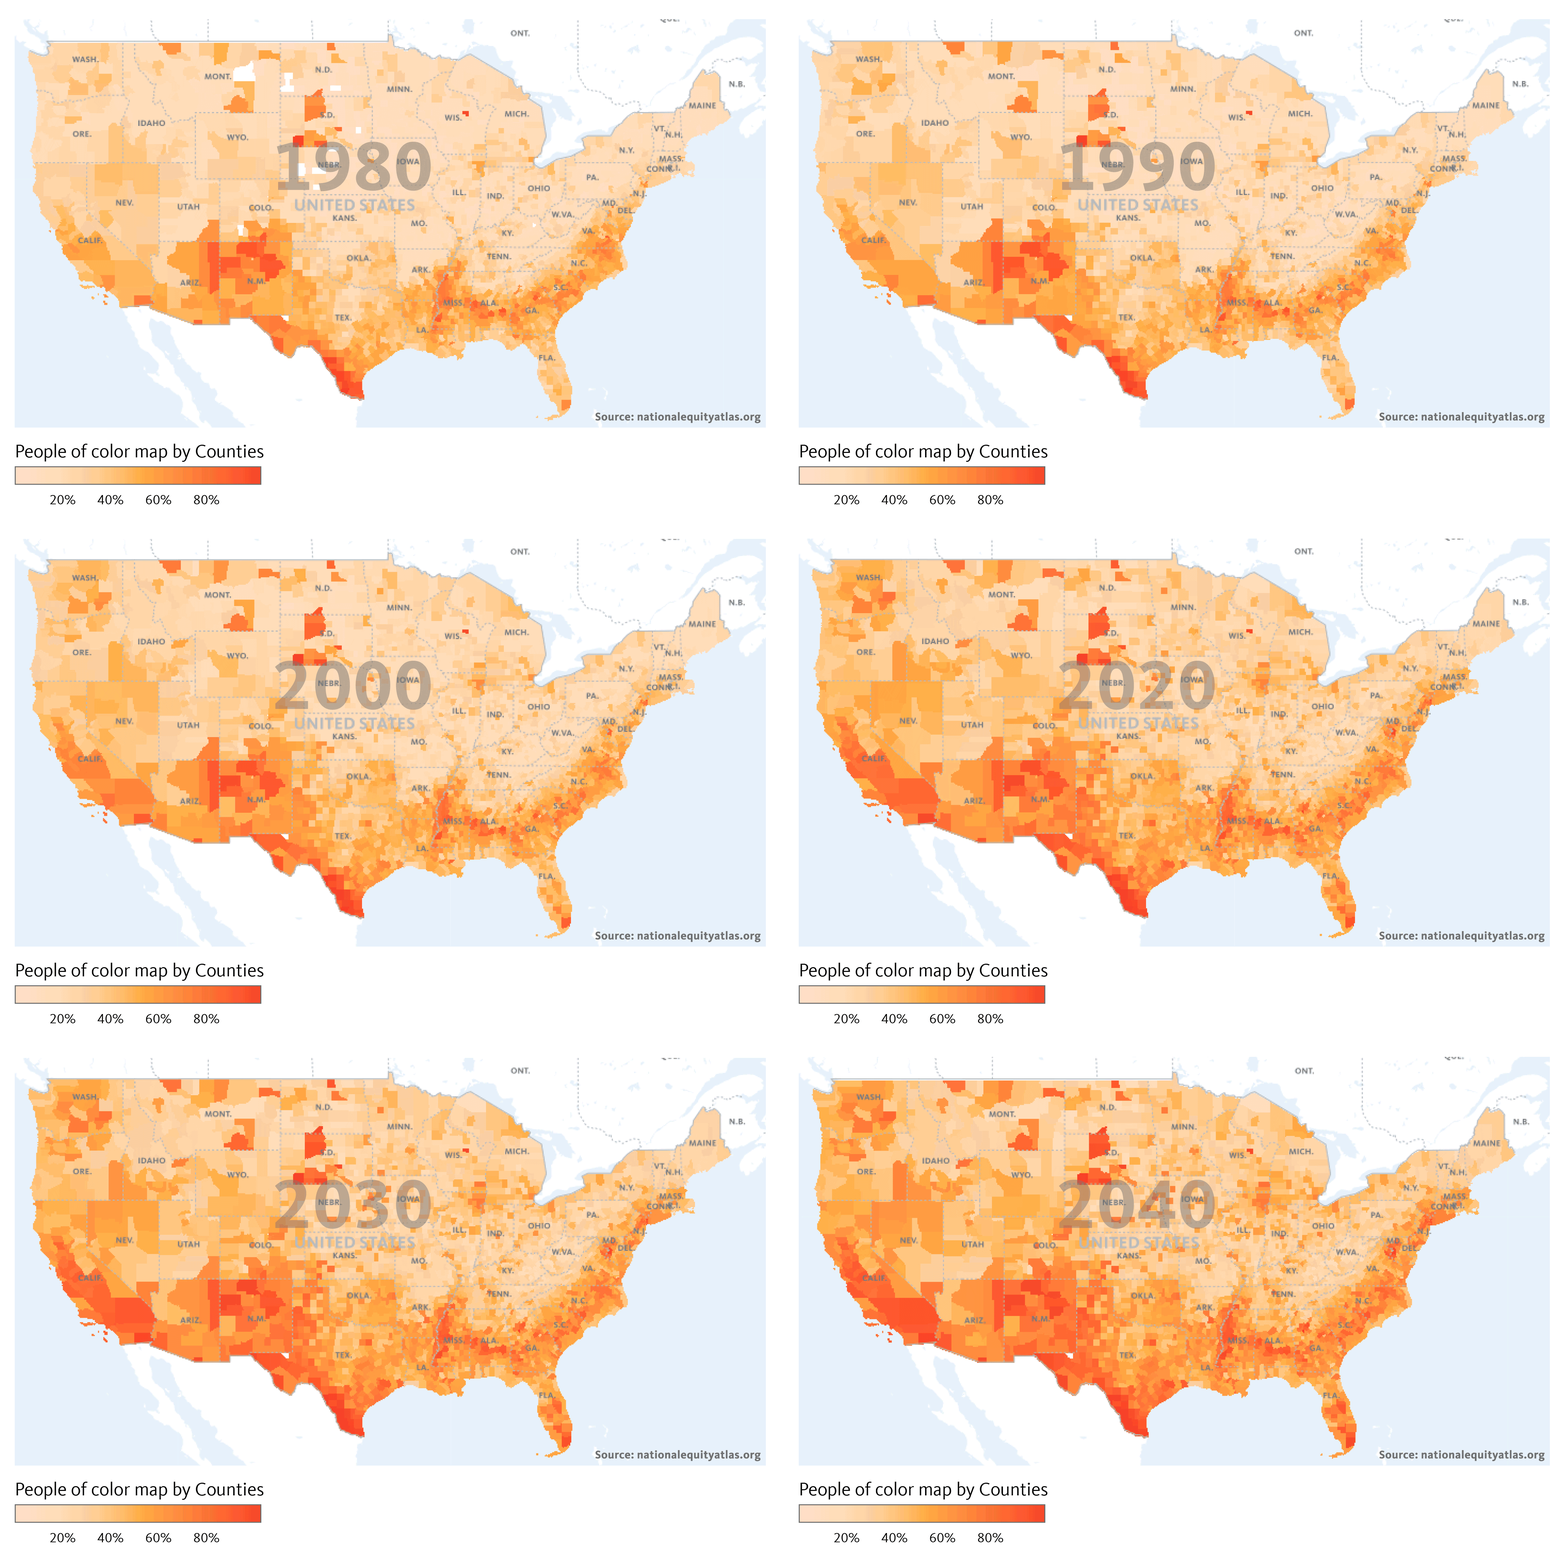
Today’s policy decisions will affect the future growth and prosperity of the nation for years to come. To illustrate the importance of racial equity, this week’s chart is a GIF showing the percent people of color in the U.S., by county, from 1980 to 2040. With each decade going forward, the strength of our economy increasingly depends on the readiness and full inclusion of people of color as workers, innovators, entrepreneurs, and leaders. On Tuesday, vote for candidates who will invest in our future workforce and build an economy that works for all.

In 1980, the U.S. was 20 percent people of color. The dark orange counties, representing areas where people of color comprised more than 80 percent of the population, were located throughout the South and Southwest, with the exception of Native American reservations in the Dakotas and Wisconsin. From 1980 to 2020, the share of people of color in the United States is expected to more than double to 41 percent. By 2040, the U.S. is projected to be 49 percent people of color.
According to 2015 Census data, 370 counties, home to nearly one in three Americans, are already majority people of color. That’s up from 339 counties in 2010. Some of the counties that have become majority people of color in the last five years include parts of Fort Worth and Austin in Texas and Charlotte, North Carolina.
To see how the share of people of color is expected to change through 2040 in your community, visit the National Equity Atlas, and type in your region or state. Download the chart and share it on social media using #equitydata.