
Chart of the Week: Save AFFH and Federal Geospatial Databases
To add equity data to the national dialogue about growth and prosperity, every week the National Equity Atlas team posts a new chart from the Equity Atlas related to current events and issues.
Last month, we wrote about the dangers of the proposed Local Zoning Decisions Protection Act of 2017, and this week we heard that the House of Representatives may bring its HUD funding bill for the remainder of FY17 to the floor for a vote next week. Representative Paul Gosar (Arizona-04) will likely file an amendment that adopts some or all of the language in the bill.
The National Fair Housing Alliance, PolicyLink, the ACLU, and the National Low Income Housing Coalition have coordinated to prepare a sign on letter in opposition to Rep. Gosar’s expected amendment. CLICK HERE to read and sign on to the letter, and please share with your local, state, and national networks! The deadline to sign on is Tuesday, February 28.
As letter describes, even though the Fair Housing Act has been on the books for nearly a half century, cities, counties and states that receive federal funds for housing and community development had little guidance about how to fulfill the fair housing obligations to which they agreed in exchange for receiving those funds, and few tools for doing so. The 2015 Affirmatively Furthering Fair Housing (AFFH) rule responds to requests from HUD grantees for greater guidance and more support in furthering fair housing, as well as recommendations made by the Government Accountability Office in a 2010 report based on its review of HUD’s fair housing oversight.
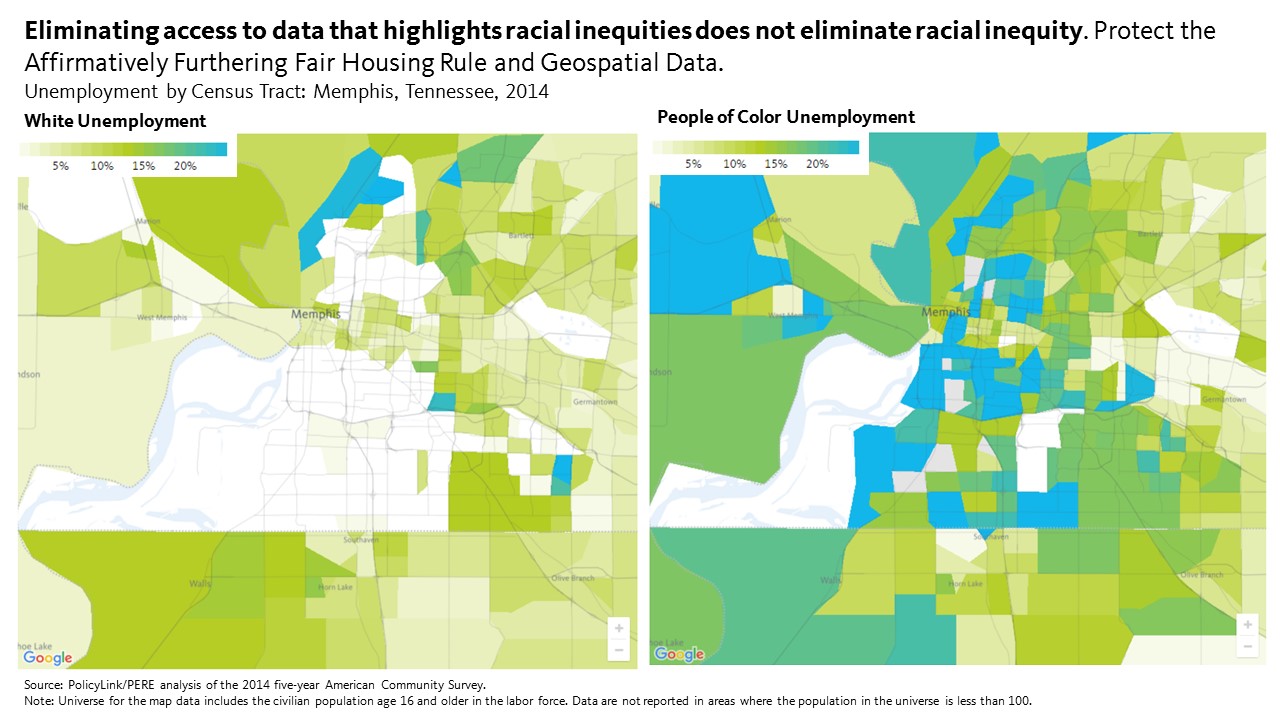
This week’s chart highlights the importance of spatial data and this rule in particular by showing two maps of unemployment in Memphis, Tennessee. The map on the left shows white unemployment by neighborhood and the map on the right shows unemployment for people of color by neighborhood. The darker blue census tracts represent areas where the unemployment rate is more than 20 percent. On the white unemployment map, there are only a few neighborhoods where unemployment is higher than 20 percent but on the people of color map, there are several clustered throughout the city. Racial differences in employment result from differences in education, training, and experience as well as barriers to employment for workers of color such as English language ability, immigration status, criminal records, lack of transportation access, and racial discrimination and bias among employers and institutions. The AFFH rule provides local jurisdictions with spatial data like this to ensure that federal dollars go towards making all communities neighborhoods of opportunity.
Please consider signing on the letter and sharing it with your local, state, and national networks and share on social media why you oppose amendments to the T-HUD bill that would repeal HUD’s Affirmatively Furthering Fair Housing (AFFH) regulation, require HUD to use its limited resources to duplicate previous consultations with state and local governments about how to fulfill their fair housing obligations, and block public access to government geo-spatial data.
To see how unemployment varies in your city, region, or state, visit the National Equity Atlas and share the map of your community using #equitydata.