
Chart of the Week: #ProtectMedicaid
To add equity data to the national dialogue about growth and prosperity, every week the National Equity Atlas team posts a new chart from the Equity Atlas related to current events and issues.
Last week, Senate Republicans unveiled their health care bill to repeal and replace the Affordable Care Act (ACA). Like the ACA, the House and Senate bills provide health insurance subsidies through tax credits. But they also roll back federal money to states that opt-in to the Medicaid expansion through the ACA and end Medicaid as an open-ended entitlement.
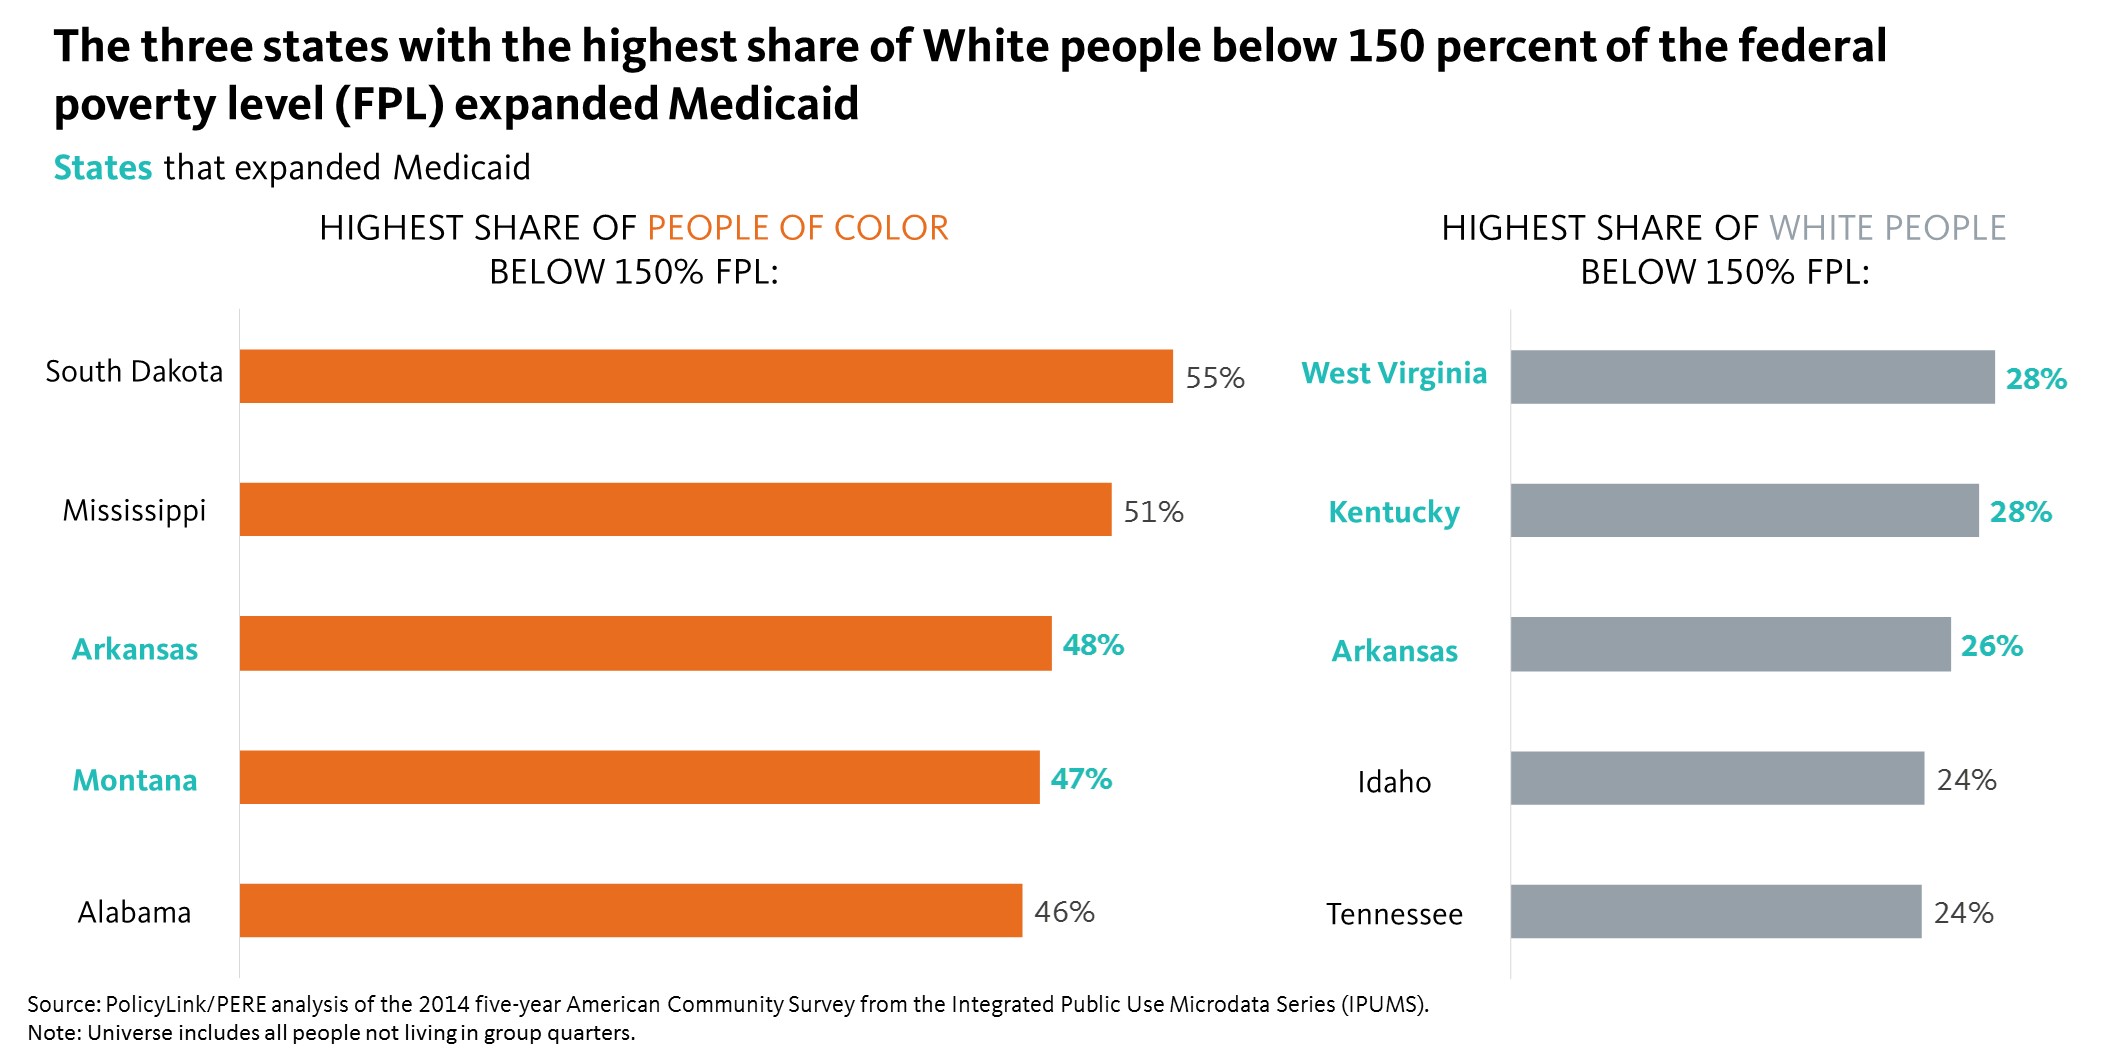
This week’s chart highlights the share of people living below 150 percent of the federal poverty level (FPL) and the states that have expanded Medicaid coverage. For states that have expanded coverage, individuals in a household with an income below 138 percent of the FPL are eligible for Medicaid. As the chart below shows, among the five states with the highest share of people of color below 150 percent of the FPL, only Arkansas and Montana have elected to expand Medicaid. The two states with the highest share of people of color below 150 percent of the FPL —South Dakota and Mississippi, where more than half of people of color live below this poverty threshold — have not expanded Medicaid. At the same time, the three states with the highest share of White people below 150 percent of the FPL — West Virginia, Kentucky, and Arkansas — have expanded Medicaid.
As the Senate prepares to bring the health care bill to the floor this week, call your Senators at (202) 224-3121 to encourage them to save Medicaid, which insures nearly one in five Americans.
To see how poverty varies in your city, region, or state, visit the National Equity Atlas and share the chart of your community using #ProtectMedicaid and #equitydata.