
Chart of the Week: Getting Infrastructure Right in Baltimore
To add equity data to the national dialogue about growth and prosperity, every week the National Equity Atlas team posts a new chart from the Equity Atlas related to current events and issues.
In the latest issue of the Stanford Social Innovation Review, PolicyLink CEO Angela Glover Blackwell makes the case for the #CurbCutEffect—the idea that policies and programs designed to benefit marginalized groups often end up benefiting society as a whole. Equitable public transportation investments, for example, that connect underserved residents to employment and regional economic opportunities can generate benefits that extend beyond individual residents. Better transportation options for those who have been historically disconnected from the region means employers have better access to labor. It also means lower turnover and greater retention, which decrease costs for businesses. And as employment increases, so does taxable income.
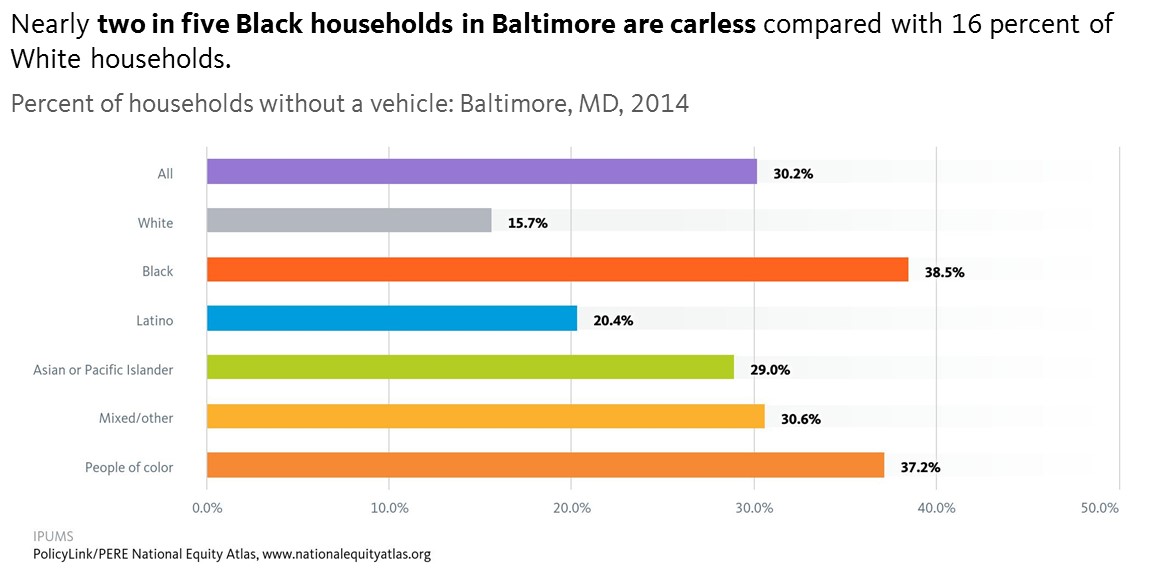
To illustrate the importance of equitable infrastructure investments in the United States, this week’s chart looks at the share of households without a vehicle in Baltimore, Maryland. Nationally, 9 percent of households are without a vehicle, but in Baltimore, that number is 30 percent. White households are the least likely to be carless—just 16 percent of White households do not have a vehicle. Black households, on the other hand, are the most likely to be carless: nearly 39 percent do not have a car.
How far the potential benefits of public transit investments in Baltimore extend depend on how targeted they are and whether decision makers use investments to advance racial equity. A recent article in Citylab highlighted that bike infrastructure in Baltimore appears to be concentrated in Whiter, more affluent neighborhoods, but Bikemore is working to change this by centering equity, safety, and health and tackling the historic disinvestment in Black communities head on. As Blackwell explains, “when the nation targets support where it is needed most—when we create the circumstances that allow those who have been left behind to participate and contribute fully—everyone wins.”
To see how car access varies by race/ethnicity in your city or region, visit the National Equity Atlas, type in your city or region, and share the map for your community using #equitydata. To read “The Curb Cut Effect,” visit the Stanford Social Innovation Review.