
Data by Ancestry Illustrates Difference in Educational Attainment across Asian and Pacific Islander Communities
Educational attainment is a key data point that has been used perpetuate the “model minority” myth suggesting that the Asian and Pacific Islander (API) population achieves higher socioeconomic success than other major racial/ethnic groups. For advocates of the API community this is concerning, especially for those subgroup populations that fare much worse than average across socioeconomic indicators. For these groups, their struggles are rendered invisible by the myth of the model minority, which has implications for their prospects in the workforce.
On May 23, PolicyLink and the USC Program for Environmental and Regional Equity added new ancestry breakdowns to six indicators in the National Equity Atlas. This is the second in a series of analyses of the new data, focusing on the “educational levels and job requirements” indicator for the API community.
Southeast Asian and Pacific Islander Adults Have the Lowest Rates of Educational Attainment
Data from the Georgetown University Center on Education and the Workforce predict that by 2020, 43 percent of jobs will require an Associate’s degree or higher. And 33 percent of jobs will require at least a Bachelor’s degree. In aggregate, APIs tend to have higher education levels compared to other major racial/ethnic groups – 60 percent of working age APIs (adults between ages 25 and 64) have at least an AA degree. That’s about double the percentage for all people of color and surpasses all other major racial groups. However, once we disaggregate these data by ancestry we see that there is a fair amount of variation within the API community.
While APIs have some of the highest rates of educational attainment across major racial/ethnic groups, some groups have much lower than average rates. Nationally, this particularly rings true for Southeast Asian and Pacific Islanders groups. Only about one in five Tongan, Samoan, Laotian, and Cambodian working age adults have an AA degree or higher, proportions similar to those of Latinos (20 percent) and Native Americans (23 percent). On the other hand, some South and East Asian groups have the some of the highest levels of educational attainment: roughly three-quarters of Indian (77 percent) and Taiwanese Americans (75 percent) have a BA degree of higher.
Pacific Islander populations consistently had lower levels of educational attainment across regions which does not bode well for these groups attaining jobs of the future. For example, the Salt Lake City region has a significant Pacific Islander population, but only 6 percent of working age adults have a BA or higher while the share of jobs requiring that level of education will be 29 percent in 2020.
Higher Rates of Educational Attainment for Indian and Chinese Adults, but Some Geographic Variation
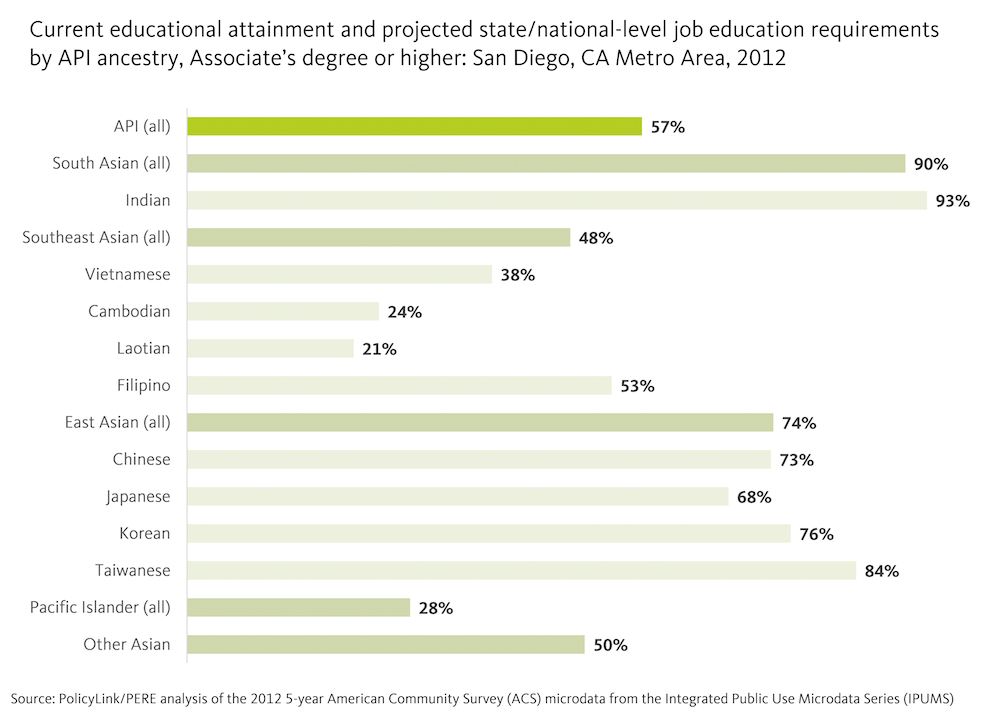
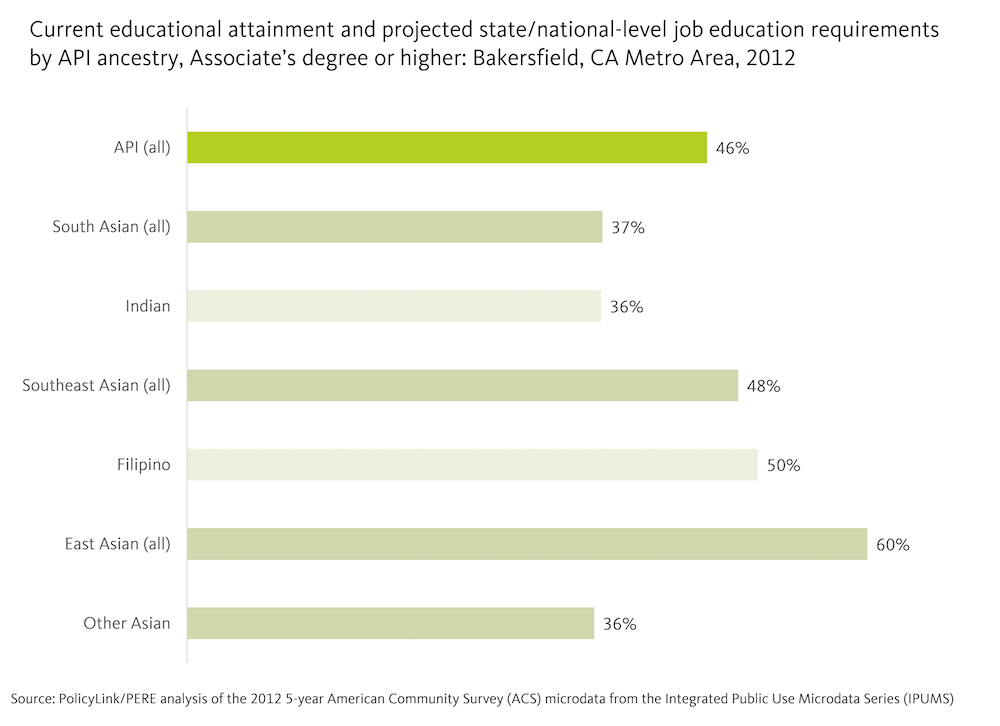
While the national trend generally holds true across cities and regions, place has a definite impact on educational attainment levels for some API subgroups, especially those groups that nationally have some of the highest levels of educational attainment. For example, Indians from regions in California’sCentral Valley are much less likely to have an AA degree or higher than their counterparts in the state’s larger regions: 36 percent of Indian’s in Bakersfield have an AA degree or higher compared to 93 percent in San Diego. It is important to note that these differences are not just due to differences that regions have in terms of educational attainment. In this example, educational attainment is lower overall in Bakersfield than in San Diego, but Indians still have lower than average attainment among API group in Bakersfield whereas in San Diego, Indians have the highest attainment among APIs.
In some cases, a subgroup’s geographic variation can differ between a region and its central city. For example, 32 percent of Chinese working age adults in the city of Philadelphia have an AA degree of higher, compared to 57 percent for the region, suggesting disparities between the city and its suburbs. Similar trends holds true in other northeastern regions including Boston and New York.
Disaggregated Data Critical to Developing Regional Inclusive Growth Strategies
We know that America’s future jobs will continue to require ever-higher levels of education, but the model minority myth presupposes that API communities are already reaching those levels. Noting that API communities are some of the fastest-growing communities in the nation, it is important that all subgroups are adequately prepared to participate in an exceedingly more knowledge-driven economy.
These data — and the new disaggregated data provided on the National Equity Atlas — highlight the need for disaggregation when addressing disparities and gaps in educational attainment in communities of color, so that advocates and policymakers can ensure equitable education and job attainment opportunities.