The Challenge of Youth Disconnectedness Among Latinas
By the end of this decade, the majority of youth under age 18 will be people of color. Their ability to succeed in the labor force will determine the strength of our economy in the decades to come. Yet, data on youth disconnectedness show we are failing the very people we are supposed to nurture, educate, and prepare to become the leaders of tomorrow. As the National Equity Atlas shows, there are 5.5 million young people ages 16 to 24 who are “disconnected” — neither working nor in school — and the majority of them are people of color.
Reconnecting these young people to education, skills, and career pathways is critical for their economic futures — and for our national prosperity. A study by scholars at Queens College, City University of New York and Teachers College, Columbia University calculates that every disconnected youth costs society $700,000 throughout their lifetime. To develop targeted solutions, it is critical to understand which youth face the greatest challenges, and that is why we added gender breakdowns to the “Disconnected youth” indicator on the Atlas.
A look at this new data reveals some surprising differences in youth disconnectedness by gender for Black and Latino young people. Below, we examine how youth disconnectedness varies by race and gender nationally, followed by a closer look at cities with the highest rates of disconnected Latinas.
Latinas face particularly high rates of youth disconnectedness
Of all major race and gender combinations, young Native American men are the most likely to be disconnected in the U.S. as a whole: 28 percent of Native American men ages 16 and 24 are neither in school nor working, followed by 25 percent of Native American young women. Young Black men are about as likely as Native American women to be disconnected. An unexpected finding is that one in five young Latinas are disconnected from school and work — a rate four percentage points higher than that for young Latinos.

Black and Native American young men are more likely to be disconnected than their female counterparts, while Latino and Asian and Pacific Islander young men are less likely to be disconnected than their female counterparts.
Cities with the highest share of disconnected Latinas
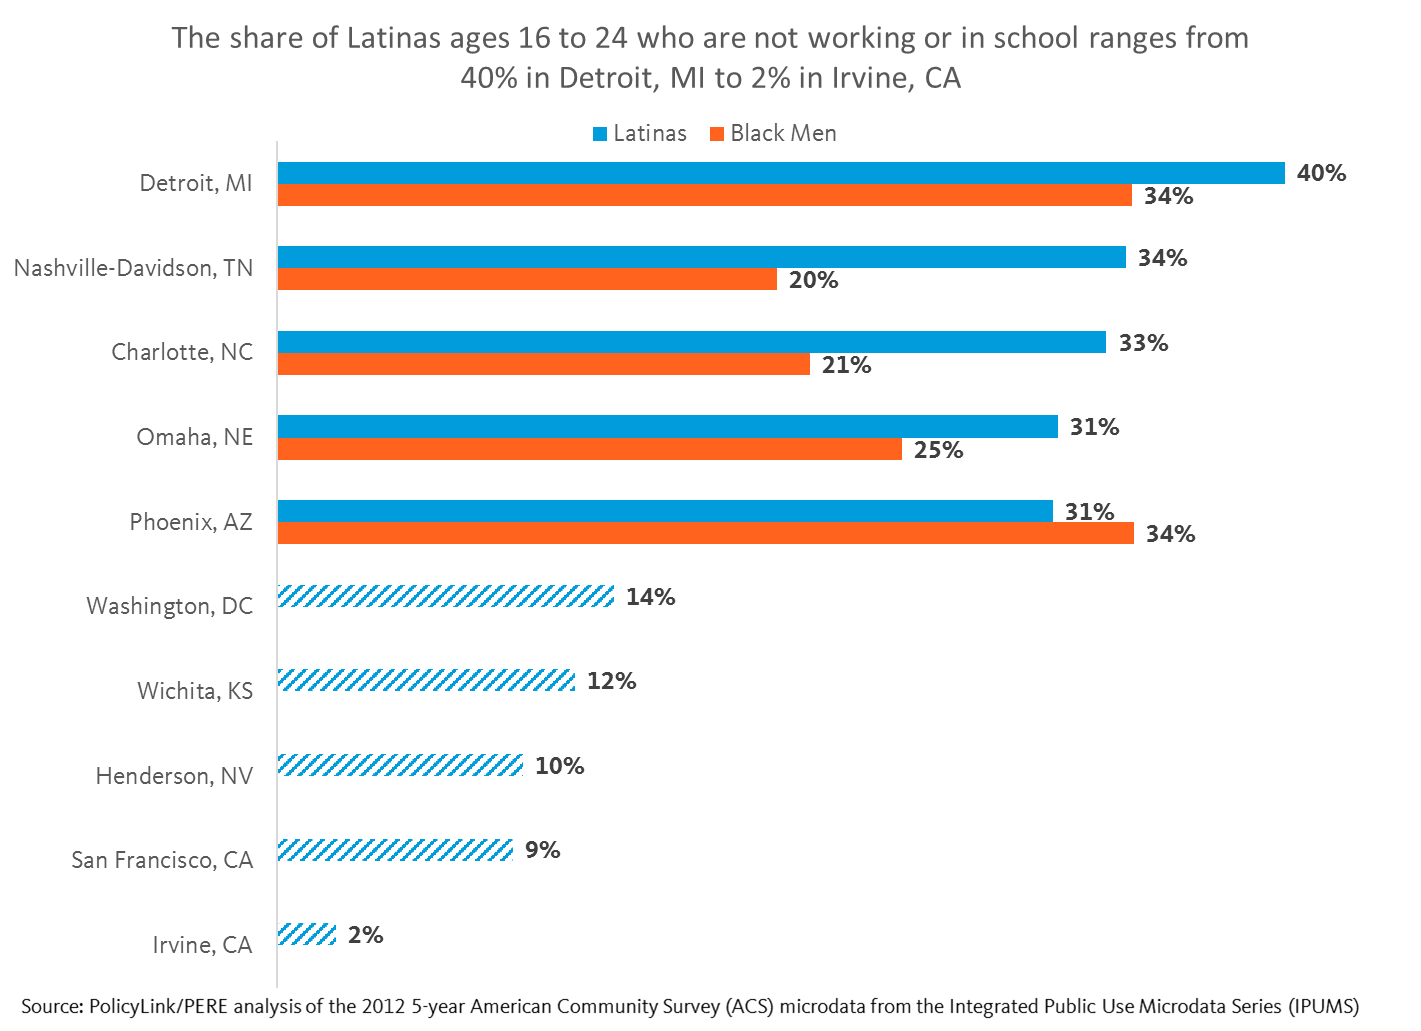
To explore how youth disconnectedness varies for young Latinas across the largest 100 cities, we looked at the cities with the highest and lowest rates of disconnection among Latinas. There was enough data on Latinas ages 16 to 24 in 69 of the 100 largest cities. The share of Latinas in this age group who are not working or in school ranges from 40 percent in Detroit to 2 percent in Irvine, California. Detroit also has the greatest overall share of disconnected youth at 30 percent of all young people, but Latinas have the highest rate of disconnectedness in that city—6 percentage points higher than the share of disconnected Black men. In four of the five cities with the largest share of disconnected Latinas, Latinas are the most likely of all race-gender groups to be disconnected. In Nashville, Tennessee and Charlotte, North Carolina, one in three Latinas ages 16 to 24 is disconnected.
There could be a number of reasons for the higher rates of Latina disconnectedness in these cities. The Queens College/Teachers College study found that female disconnected youth are more likely to have family responsibilities while male disconnected youth are more likely to be incarcerated. Another study reported that 30 percent of female disconnected youth have children compared with 11 percent of all 16- to 24-year-old females. And in 2014, national Black and Latina teen birth rates were more than two times higher than the rate for White teens. Importantly, poverty and low levels of education correlate with teen pregnancy, and young people in the child welfare system are also more likely to become pregnant.
Early disconnection can have profound impacts later in life, particularly when it comes to employment, health, and participation. The American Public Health Association explained in a recent video that an 18-year-old male in California was more likely to be arrested in 2014 than he was to vote. And there is even evidence suggesting that employers use gaps in work history as a proxy for criminal activity or incarceration, which disproportionately impacts the job prospects of Black men.
Where do Latinos have higher rates of disconnection than Latinas?
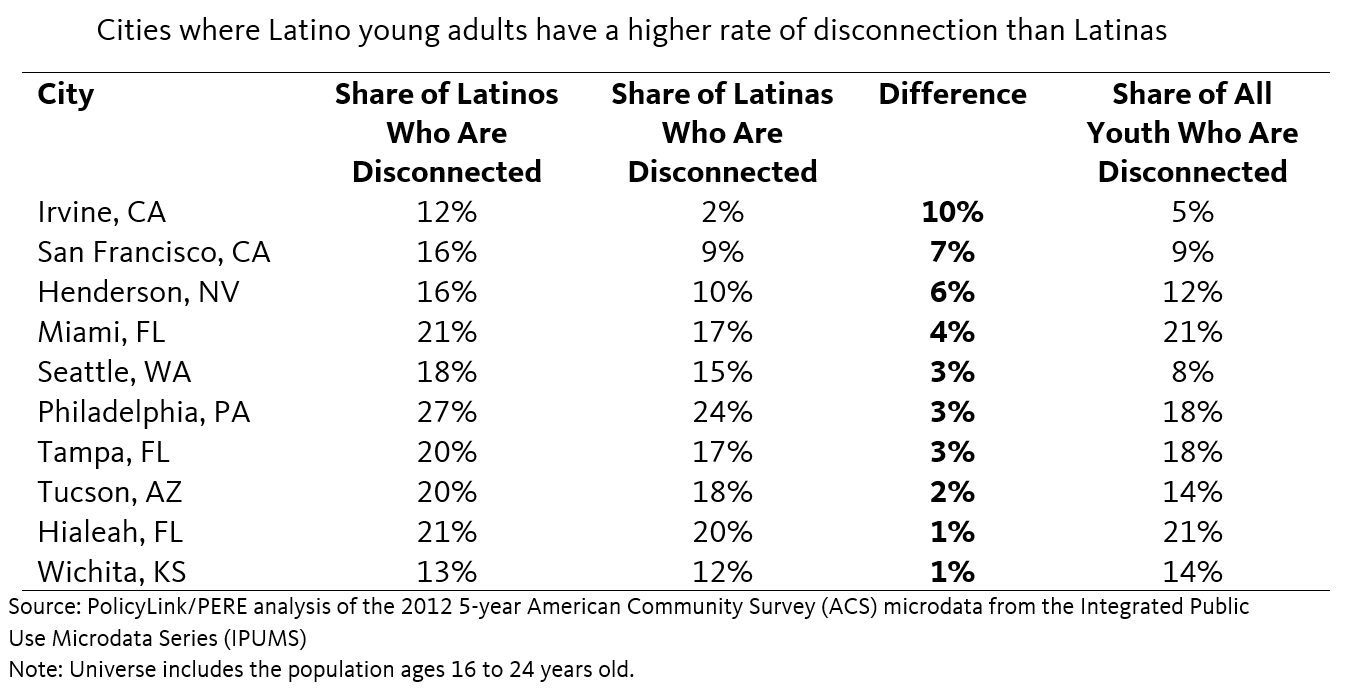
The share of disconnected Latinos is larger than the share of disconnected Latinas in only 11 of the 69 cities with sufficient data on Latina disconnection. In most of those cities, the difference is just a couple percentage points, except in Henderson, Nevada, San Francisco, California, and Irvine, California—the three cities with the lowest rates of disconnection among Latinas. The difference is largest in Irvine, California, where 12 percent of Latinos are disconnected compared with just 2 percent of Latinas.
 Strategies for racial and gender justice
Ensuring that all young people are healthy, educated, and connected to opportunities is essential for economic prosperity. Solutions are comprehensive and require participation across education, juvenile justice, and child welfare systems. Reforming harsh, “zero tolerance” school discipline policies that put boys and girls of color on track to jail rather than college is key to keeping young people in classrooms. And transforming classroom learning by integrating work-based and linked learning opportunities as well as culturally relevant education can help ensure that students are college and career ready at graduation.
In the quest for targeted strategies that focus resources toward historically disadvantaged populations, disaggregated data is ever more important to ensure that resources reach and benefit the most affected groups. The new gender data added to the National Equity Atlas for the Working poor, Disconnected youth, and Education levels and job requirements indicators allows communities to capture some of this variation in order to better inform local knowledge and strategies.
To learn more about how women and men of color are faring in your community, go to the Indicators tab, select one of the five equity indicators that have data by gender (Working poor, Disconnected youth, Education levels and job requirements, Wages: $15/hour, and Wages: Median), and click on the “By gender” breakdown.