National Equity Atlas Added to Health and Community Development Site, MeasureUp

The Build Healthy Places Network—which connects leaders and practitioners across the health and community development sectors—has just added the National Equity Atlas to its microsite of resources and tools, MeasureUp. On this site, they’ve curated some of the best examples of measurement and action in addressing the social determinants of health, spanning logic models, data sets, mapping tools, issue briefs, and videos. MeasureUp is intended to help advocates and practitioners measure and communicate the impact of their work.
 
You can find the National Equity Atlas on their Mapping Tools page.


New Data on Homeownership by API Subgroups Uncovers Gaps by Ancestry

The diverse range of Asian, Pacific Islander, and Native Hawaiian communities in the United States represents many different languages and countries of origin. When these communities are grouped together into a single “Asian or Pacific Islander” (API) category, that aggregated group appears to do quite well by common measures of social and economic success. But looking at the data this way obscures important differences in experience – for example, among Native Hawaiians, third-generation Japanese Americans, and Burmese immigrants – and hides the particular challenges faced by many groups within that broader community.

On May 23, PolicyLink and the USC Program for Environmental and Regional Equity added new ancestry breakdowns to six indicators in the National Equity Atlas. This, the fourth in a series of analyses of the new data, examines the homeownership indicator.

This indicator is emblematic of the “American dream” and provides an important measure of family wealth and asset building. It also reveals vastly different outcomes among API subgroups. Of course, analyzing socioeconomic data cannot convey the range of chronic stresses caused by racism and stereotypes; but it can provide a better understanding of the diversity of experiences that exist within the API community in the United States.

Homeownership Is Significantly Lower Among APIs than Non-Hispanic Whites

For many of the indicators of economic vitality and readiness included in the National Equity Atlas, Asians and Pacific Islanders and Native Hawaiians (APIs), as a group, appear to be doing better than their White counterparts. Compared to Whites, the API community earns higher median wages, achieves greater levels of educational attainment, and experiences lower rates of unemployment and youth disconnection.  However, this trend does not extend to homeownership.


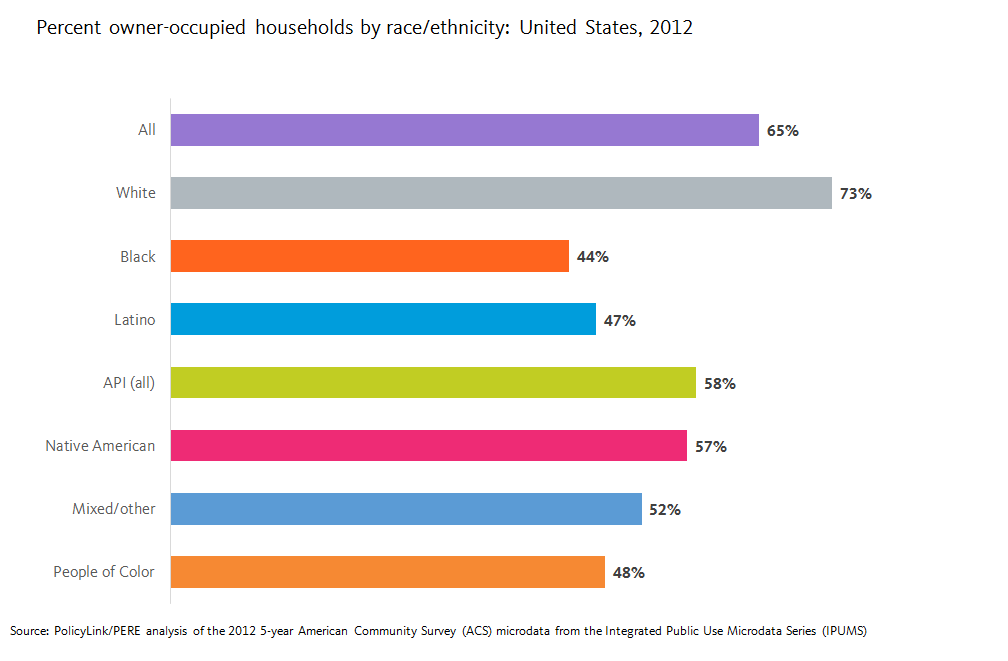
As the chart above illustrates, APIs have a homeownership rate of 58 percent — 10 percentage points higher than the rate for all people of color combined, but 15 percentage points lower than the homeownership rate of Whites (73 percent). Still, the relatively high rate of homeownership for APIs compared to other groups of color masks underlying differences within the diverse experiences of different API populations and reinforces the model minority stereotype.

What Does Examining Homeownership by Subgroup Tell Us?

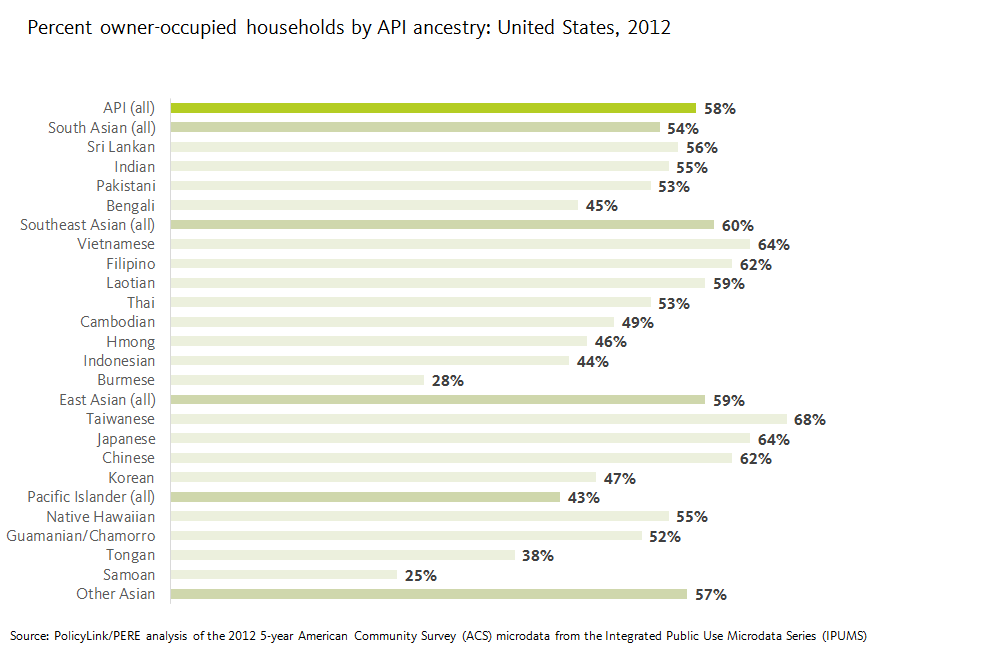
Among all APIs, 58 percent of households are owner occupied. Between the various API subgroups, however, rates of homeownership vary widely. The lowest rates of homeownership are found among those of Samoan (25 percent), Burmese (28 percent), and Tongan (38 percent) ancestry. At the other end of the spectrum, the highest rates of homeownership are found among two Southeast Asian ancestry groups —Vietnamese (64 percent) and Filipino (62 percent) — and three East Asian groups: Taiwanese (68 percent), Japanese (64 percent), and Chinese (62 percent). But one East Asian group lags far behind the others: homeownership among people of Korean ancestry is just 47 percent.

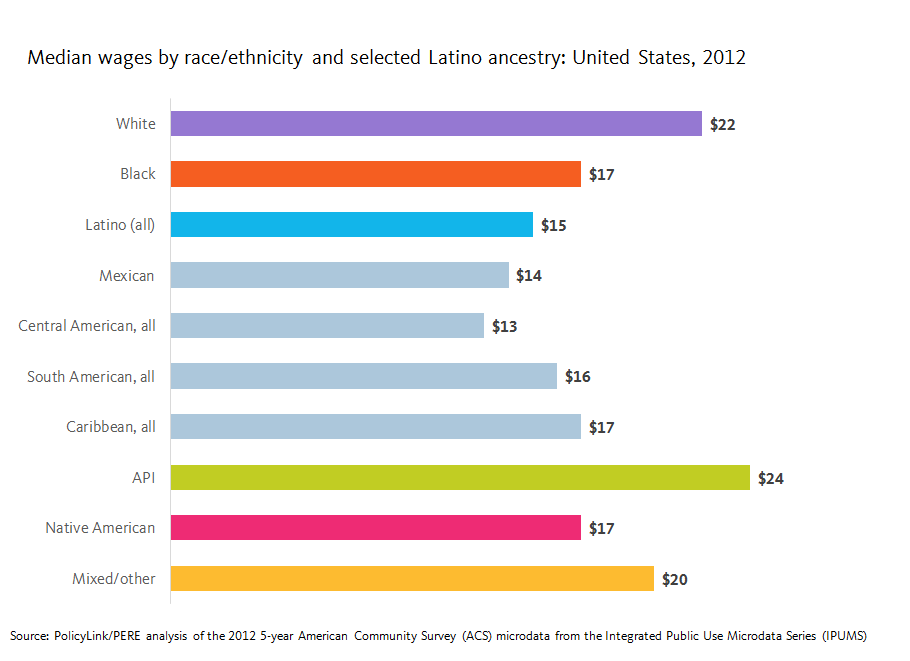
Some of this difference may be explained by other factors related to family economic vitality: people of Korean ancestry attain average educational levels but earn lower median wages and experience higher rates of unemployment than other East Asian ancestry groups. Yet overall racial gaps in homeownership between Whites and APIs confirm that measures of education, employment, and wages do not necessarily predict homeownership rates.  

How Do These Patterns Differ Across U.S. Regions?

Even within a given ancestry group, of course, rates of homeownership are affected by a host of factors related to regional economic conditions, migration patterns, and local real estate markets. Among the U.S. regions with sufficient data to report homeownership rates for people of Korean ancestry, there are significant variations. Overall, these rates range from 30 percent in the Austin, Texas metro area to 66 percent in the Riverside, California metro area, as illustrated below. The five metro areas with the highest rates of homeownership among those of Korean ancestry are Riverside, California (66 percent); Denver, Colorado (65 percent); Washington, DC (61 percent); Houston, Texas (61 percent); and Portland, Oregon (60%) — all rates above the national average not only for the Korean subgroup but for all APIs.

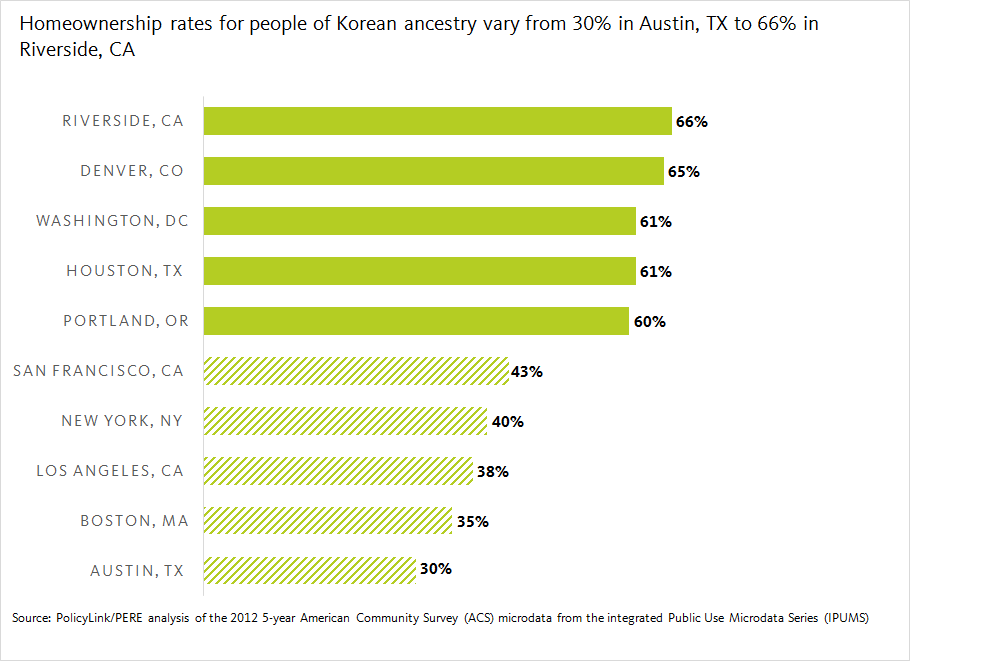
It is perhaps not surprising that the five metro areas with the lowest rates of homeownership in the Korean ancestry subgroup, shown below, coincide with some of the most expensive real estate markets in the country: San Francisco, California (43 percent); New York, New York (40 percent); Los Angeles, California (38 percent); Boston, Massachusetts (35 percent); and Austin, Texas (30 percent). In these regions, homeownership among the Korean ancestry subgroup is well below the national average.

Yet is also important to note that in each of these metro areas, homeownership among residents of Korean ancestry is also significantly lower than the regional rate of homeownship for all residents. In San Francisco, New York, and Los Angeles, there is a 12 percentage-point difference between the Korean subgroup and the regional average. In Boston, the gap is 27 percentage points. And in Austin, where overall homeownership is 58 percent, the gap is a staggering 28 percentage points.

Disaggregated Data Can Inform Tailored Housing Policy Solutions

Homeownership can be an important pillar of financial security and a tool for economic mobility for low- and middle-income families. But various social and market forces continue to produce barriers to homeownership for communities of color. Often these barriers are related to family income and assets, but redlining, discriminatory lending, and structural racism are also at play.

Disaggregated data can help advocates and policymakers identify the specific challenges that put homeownership out of reach for particular communities and identify strategies to alleviate them. This data makes clear that groups working on issues related to financial inclusion, asset building, and homeownership in a given region should identify whether particular groups are being left behind, work to identify specific barriers, and target outreach and resources to those who need them most.  For example, In New York, Asian Americans for Equality provides homeownership support services through its community development fund, including multilingual counseling, outreach, and education in Cantonese, Mandarin, Spanish, and Korean.

Explore the status of homeownership in your city or region here.

Data by Ancestry Shows Wage Differences Among Latinos in the United States and Selected High-Cost Metros

In the United States, Latino workers earn the lowest median wages of any major racial group: just $15, compared with $22 for their White counterparts — a 32 percent difference. While these national measures bring into focus one of the most significant racial wage gaps in the country, they also obscure differences that exist within the broader Latino population as well as regional differences in wages and cost of living.

On May 23, PolicyLink and the USC Program for Environmental and Regional Equity added new ancestry breakdowns to six indicators in the National Equity Atlas. This is the third in a series of analyses of the new data, examining the “median wages” indicator for Latino workers.

Latinos Are Paid Significantly Less than Workers in Other Racial Groups – And Central Americans Tend to Be Paid Least of All

Among all U.S. workers, Asians and Pacific Islanders earn the highest median wages ($24), followed by Whites ($22), other/mixed race workers ($20), Blacks ($17), Native Americans ($17), and Latinos ($15). Yet as new data in the National Equity Atlas shows, average pay ranges widely within each of these groups. Among Latino subgroups, workers of Panamanian, Venezuelan, Chilean, and Argentinian ancestry earn the most – $19 per hour – while those of Guatemalan and Honduran ancestry earn an average of just $12 per hour. As the chart below illustrates, workers of Caribbean and South American ancestry tend to earn more than the average Latino worker, while those of Mexican and Central American ancestry tend to earn less than other Latinos.

Low Wages Persist for Central American Groups Even in Highest-Cost Regions

As the data in the Atlas shows, wages tend to vary widely by region due to local economic conditions. To take a closer look at differences in pay within the Latino community, we examined median wages in the 25 U.S. metros with the highest cost of living, measured by something called “regional price parities" (or RPPs). Calculated by the U.S. Department of Commerce, Bureau of Economic Analysis, RPPs indicate relative differences in the cost of goods and services across states and metropolitan areas.  They are expressed as a percentage of the average national price level. For example, the most expensive U.S. metro in 2013 was Honolulu, HI, with an RPP of 122.5, while the least expensive was Beckley, WV, with an RPP of 78.

On average, the highest cost metros have the highest median wages; yet they also have staggering levels of wage inequality.  The table below compares the wages of non-Hispanic White workers with their Latino counterparts of Central American ancestry in the three metro areas with the largest Central American populations: Los Angeles, CA; New York, NY; and Washington, DC. These three regions also happen to be ranked among the top 10 most expensive metros in the country.

In the Los Angeles metro area, Latino workers of Central American ancestry earn a median hourly wage of $12.30 compared with $29.70 for their White counterparts, representing a wage gap of 59 percent. In the New York metro, the median wage for Latinos of Central American ancestry is $13.00 compared with $30.45 for White workers, resulting in a wage gap of 57 percent. The wage disparity is even greater in the Washington, DC region, where Central American Latinos earn a median wage of $14.10 but White workers earn $35.15, making the racial wage gap between these groups a staggering 60 percent.

These differences are partly reflective of vast disparities in educational attainment between these groups. In Los Angeles, just 12 percent of Central American Latinos have earned at least an associate’s degree, compared with 57 percent of Whites; in New York, 14 percent of Central American Latinos compared with 58 percent of Whites; and in Washington, DC, only 11 percent of Central American Latinos compared with 69 percent of Whites.

Wages Vary Widely Both Among and Between Racial Groups

Los Angeles is home more than 718,000 Latinos of Central American ancestry — the largest such population in the United States. The graphic below illustrates the median wages of the six major racial groups in the Los Angeles metro region, as well as disaggregated data for Latinos. As the chart illustrates, the median wages of Central Americans trail not only other racial groups, but other Latinos as well. Workers of Guatemalan ancestry in Los Angeles earn an average of $11 per hour; Salvadorans, $12; Hondurans, $11; Nicaraguans, $15; and Costa Ricans, $19. Among Central American workers in Los Angeles, only those of Costa Rican ancestry earn higher average wages than Latino workers in general.

Disaggregated Data Critical to Developing Regional Inclusive Growth Strategies

We know that America’s future economic strength will depend on growing good jobs and ensuring that all workers — regardless of race, gender, or zip code — have access to stable employment with family-supporting wages and benefits. Latinos are the fastest-growing group in the United States, so ensuring that they are paid a fair, living wage is not only essential to family economic security but also to the vitality of our regional and national economies. 

The new data on the National Equity Atlas highlight the need for disaggregation when developing strategies to address economic inequity, from targeted economic development and workforce efforts to worker organizing. By developing a clearer picture of the groups and communities struggling to make ends meet through low-wage work, advocates and policymakers can tailor their support to those who need it most.

Data by Ancestry Illustrates Difference in Educational Attainment across Asian and Pacific Islander Communities


Educational attainment is a key data point that has been used perpetuate the “model minority” myth suggesting that the Asian and Pacific Islander (API) population achieves higher socioeconomic success than other major racial/ethnic groups. For advocates of the API community this is concerning, especially for those subgroup populations that fare much worse than average across socioeconomic indicators.  For these groups, their struggles are rendered invisible by the myth of the model minority, which has implications for their prospects in the workforce.

On May 23, PolicyLink and the USC Program for Environmental and Regional Equity added new ancestry breakdowns to six indicators in the National Equity Atlas. This is the second in a series of analyses of the new data, focusing on the “educational levels and job requirements” indicator for the API community.

Southeast Asian and Pacific Islander Adults Have the Lowest Rates of Educational Attainment

Data from the Georgetown University Center on Education and the Workforce predict that by 2020, 43 percent of jobs will require an Associate’s degree or higher. And 33 percent of jobs will require at least a Bachelor’s degree. In aggregate, APIs tend to have higher education levels compared to other major racial/ethnic groups – 60 percent of working age APIs (adults between ages 25 and 64) have at least an AA degree. That’s about double the percentage for all people of color and surpasses all other major racial groups. However, once we disaggregate these data by ancestry we see that there is a fair amount of variation within the API community.

While APIs have some of the highest rates of educational attainment across major racial/ethnic groups, some groups have much lower than average rates. Nationally, this particularly rings true for Southeast Asian and Pacific Islanders groups. Only about one in five Tongan, Samoan, Laotian, and Cambodian working age adults have an AA degree or higher, proportions similar to those of Latinos (20 percent) and Native Americans (23 percent). On the other hand, some South and East Asian groups have the some of the highest levels of educational attainment: roughly three-quarters of Indian (77 percent) and Taiwanese Americans (75 percent) have a BA degree of higher.

Pacific Islander populations consistently had lower levels of educational attainment across regions which does not bode well for these groups attaining jobs of the future. For example, the Salt Lake City region has a significant Pacific Islander population, but only 6 percent of working age adults have a BA or higher while the share of jobs requiring that level of education will be 29 percent in 2020.

Higher Rates of Educational Attainment for Indian and Chinese Adults, but Some Geographic Variation

While the national trend generally holds true across cities and regions, place has a definite impact on educational attainment levels for some API subgroups, especially those groups that nationally have some of the highest levels of educational attainment. For example, Indians from regions in California’sCentral Valley are much less likely to have an AA degree or higher than their counterparts in the state’s larger regions: 36 percent of Indian’s in Bakersfield have an AA degree or higher compared to 93 percent in San Diego. It is important to note that these differences are not just due to differences that regions have in terms of educational attainment. In this example, educational attainment is lower overall in Bakersfield than in San Diego, but Indians still have lower than average attainment among API group in Bakersfield whereas in San Diego, Indians have the highest attainment among APIs.

In some cases, a subgroup’s geographic variation can differ between a region and its central city. For example, 32 percent of Chinese working age adults in the city of Philadelphia have an AA degree of higher, compared to 57 percent for the region, suggesting disparities between the city and its suburbs. Similar trends holds true in other northeastern regions including Boston and New York.


Disaggregated Data Critical to Developing Regional Inclusive Growth Strategies

We know that America’s future jobs will continue to require ever-higher levels of education, but the model minority myth presupposes that API communities are already reaching those levels. Noting that API communities are some of the fastest-growing communities in the nation, it is important that all subgroups are adequately prepared to participate in an exceedingly more knowledge-driven economy.

These data — and the new disaggregated data provided on the National Equity Atlas — highlight the need for disaggregation when addressing disparities and gaps in educational attainment in communities of color, so that advocates and policymakers can ensure equitable education and job attainment opportunities.

Data by Ancestry Reveals High Levels of Disconnectedness Among Specific Asian and Pacific Islander Communities

Asian and Pacific Islander activists and organizations have warned about the “model minority” myth for decades. While the Asian and Pacific Islander (API) population as a whole often fares above average on socioeconomic indicators, such metrics render invisible subgroup populations within the API community who face barriers to economic opportunities and inclusion. Data on “youth disconnectedness” – people ages 16 to 24 who are neither working nor in school — for the API population by ancestry illustrates the importance of examining more deeply disaggregated data. While API young adults have the lowest rate of disconnectedness among major racial/ethnic groups, with 8 percent of API youth being disconnected compared with 18 percent for youth of color as a whole, rates for some API communities are double or triple the API average.

On May 23, PolicyLink and the USC Program for Environmental and Regional Equity (PERE) added racial/ethnic breakdowns by ancestry to five indicators in the National Equity Atlas. Data is available for a given Atlas state, region, or city when the sample size is large enough (at least 100 survey responses). This is the first in a series of analyses of the new data, focusing on the “disconnected youth” indicator for the API community.

Pacific Islander, Cambodian, and Burmese Youth Face the Highest Rates of Disconnectedness Nationally

While API young adults have the lowest rate of disconnectedness among major racial/ethnic groups — 8 percent, compared to 27 percent for Native Americans, 22 percent for African Americans and 18 percent for Latinos, certain groups within the API community face much higher rates. Pacific Islander youth in particular face persistently higher rates of disconnectedness. The average rate of disconnection for all Pacific Islander youth — 20 percent — falls between the overall Black and Latino averages. Among Samoan young adults in the U.S., for example, 22 percent are disconnected. Tongan, Native Hawaiian, and people who identify as “Other Pacific Islander” also have rates hovering around 20 percent.

Disconnectedness is a challenge among other Asian subgroups as well. Outside of Pacific Islanders, Cambodian young people have the highest rate of disconnection (17 percent), followed by Burmese youth (16 percent), and Laotian youth (15 percent).The challenge of youth disconnectedness is fairly consistent for Pacific Islanders across the states and regions for which data is available. “Disconnected youth” data is available for Pacific Islanders for five states (Hawaii, California, Texas, Utah, and Washington). Pacific Islander youth are faring the worst in Hawaii (26 percent disconnected), Washington (25 percent), and Utah (22 percent). In all three states, Pacific Islander youth face the highest levels of disconnectedness within the API community. Pacific Islander youth are doing better on this indicator in California (16 percent) and Texas (9 percent). In California, the Laotian and Cambodian populations have the highest levels of disconnectedness among the API community (both at 19 percent); and in Texas, the Taiwanese population is the most disconnected (12 percent).

There were four regions where data was available for Pacific Islanders (Los Angeles, San Francisco, Honolulu, and Seattle). Again, California’s Pacific Islanders had lower levels of disconnection, at 13 percent in San Francisco and 12 percent in Los Angeles, but still face higher rates than the API averages in those regions (8 and 7 percent, respectively). Honolulu’s “Other Pacific Islander” population (reporting a Pacific Islander ancestry other than Native Hawaiian, Guamanian or Chamorro, or Samoan), have the highest rate of disconnection within the Asian populations across all regions, at 34 percent.

Overall Low Rates of Disconnection for Chinese, Filipino, and Indian Young People, but Higher Rates in Certain Metros

API subgroups with very low rates of disconnection at the national level — including the three largest Asian subpopulations (Chinese, Filipino, and Indian) — can have high levels of disconnectedness in certain regions. Among Chinese young people as a whole, just 6 percent are not working or in school. But among the 25 regions for which data is available for Chinese, the rate of disconnection ranges from less than one percent in Ann Arbor and Lansing, Michigan to nearly 12 percent in the Phoenix region.

Filipino youth have an average youth disconnectedness rate of 9 percent, but this ranges widely in the 16 regions for which data on Filipinos is available, from a low of 5 percent in Chicago to a high of 17 percent in Las Vegas. Though the overall rate of disconnection in Las Vegas is 19 percent, the rate for Filipinos is more than double the rate for Chinese youth. The other regions with elevated levels of disconnectedness for Filipino youth are Vallejo (14 percent) and Stockton (13 percent).

The average rate of disconnectedness for Indian young people is 9 percent, but among the 16 regions for which data is available, the disconnected youth rate ranges from a low of 3 percent in Miami to a high of 17 percent in Detroit. Indian youth also face particularly high levels of disconnection in San Jose (16 percent).


Disaggregated Data Critical to Developing Regional Inclusive Growth Strategies

From local initiatives to the White House Council for Community Services and partnerships between organizations like YouthBuild and Starbucks, a range of stakeholders have joined forces to provide opportunities for the over 5.5 million young people in the U.S. who are not working or in school. Ensuring that these youth, over half of which are youth of color, have access to meaningful educational and employment opportunities is essential for inclusive economic growth. This data highlights the need for additional racial disaggregation when developing programs and policies targeted at disconnected youth especially given regional variation. Relying solely on aggregated data of the API community as a whole, may lead to over-generalized and deceiving conclusions. Explore the variation in disconnection from school and work among young people in your city or region here.

Ancestry Counts: New Data Helps Create Clearer Picture of Economic Opportunity


The right data is critical to inform effective policy solutions — but data describing the state of equity for particular racial and ethnic communities at the local level is often difficult to access. That is why the National Equity Atlas has added new racial subgroup data to its demographic and economic opportunity indicators.

The latest update better describes the incredible diversity within broad racial/ethnic groups, and can be used to develop targeted strategies to advance racial equity and inclusive growth. Now, when users go to the “detailed race/ethnicity" indicator, they can select “by ancestry” and see more detailed breakdowns of the Asian/Pacific Islander, Black, Latino, Native American, and White populations (e.g., Filipino, Jamaican, Puerto Rican). Users can also select “by nativity and ancestry” to get a breakdown of the share of each group who are immigrants versus U.S.-born.

These detailed racial/ethnic breakdowns have been added to several of the Atlas's economic opportunity indicators, including: median wage, unemployment, the percentage of workers making $15/hour, disconnected youth, homeownership, and educational attainment. As an example of what these data can reveal, the Atlas team will be posting a series of analyses on the “Data in Action” section of this site, beginning with today’s posts on the "disconnected youth" and "educational attainment" indicators for the Asian and Pacific Islander (API) community:
 
“Asian and Pacific Islander activists and organizations have warned about the ‘model minority’ myth for decades. While the API population as a whole often fares above average on socioeconomic indicators, such metrics render invisible subgroup populations within the API community who face barriers to economic opportunities and inclusion.”
 
The National Equity Atlas team will be hosting a 30-minute live demo of the latest data release on Thursday, May 26, 2016, at 3 p.m. Eastern/12 p.m. Pacific. Please register here.
 
You can also read more about the update in today’s Next City article, “More Muscle Added to Equity Tool.”
 
Thank you!
 
The National Equity Atlas team at PolicyLink and the USC Program for Environmental and Regional Equality (PERE)

National Equity Atlas: April Update

Dear Equity Atlas Users,

Since we launched the Atlas in October 2014, we have wanted to include data that better describes the incredible diversity within broad racial/ethnic groups and challenges the “model minority” myth that impedes action and progress toward racial equity and inclusive growth.
 
We are excited to be taking a first step toward that goal by adding two new breakdowns to our “detailed race/ethnicity” indicator. Now, when you go to that indicator, you can select “by ancestry” and see more detailed breakdowns of the Asian/Pacific Islander, Black, Latino, Native American, and White populations (e.g., Filipino, Jamaican, Puerto Rican). You can also select “by nativity and ancestry” to get a breakdown of the share of each group who are immigrants versus U.S.-born.
 
To provide some more detailed data for smaller areas, we also created broader geographic categories (e.g., South Asian, Southeast Asian, East Asian, Pacific Islander) that combine a number of ancestries. For a large, diverse region like Los Angeles (see screenshot below), you will get data for many ancestry categories, while for a smaller, less diverse region like Charleston, you will see fewer of the detailed ancestry categories.
 
We hope you enjoy digging in to the data! Here is a blog post highlighting some takeaways from the new data. In a few weeks (on May 23), we will be adding these more detailed racial/ethnic breakdowns to several of our economic opportunity indicators, including:

  • Unemployment
  • Wages: Median
  • Wages: $15/Hour
  • Disconnected Youth
  • Educational Levels
  • Homeownership


Thank you!
 
The National Equity Atlas team at PolicyLink and the USC Program for Environmental and Regional Equity (PERE)


National Equity Atlas Now Includes More Detailed Racial Subgroup Data

Since its debut in October 2014, the National Equity Atlas has disaggregated most of its 31 demographic and equity indicators by race/ethnicity using broad categories defined by the U.S. Census. Today, we are excited to announce the release of more detailed demographic data based on self-reported ancestry for all major racial groups in the U.S. Data for the Asian/Pacific Islander (API), Black, Latino, Native American, and non-Hispanic White populations is now disaggregated by ancestry as well as by nativity (i.e., immigrant or U.S.-born). On May 23, we will be adding these more detailed race/ethnicity cuts to six economic opportunity indicators: median wage, unemployment, the percentage of workers making $15/hour, disconnected youth, educational attainment, and homeownership.
 
We’ll confess: the more detailed socioeconomic indicators are what is really compelling, and you’ll have to wait a little bit longer for them. But the demographic data provides important context, helping you to better understand the racial/ethnic composition of your community, and how it is changing, at a more granular level. Below are some key takeaways from the new data.
 
Immigration policy shows up in the data
 
U.S. immigration policy has and continues to impact our demographics. Two-thirds of the 15.1 million Asian/Pacific Islanders in the U.S. are immigrants, and one in four is a Chinese or Indian immigrant. Due in part to immigration laws, this segment of the population is highly educated. More than 90 percent of the nearly 20,500 Indians of working age in Minnesota have at least a bachelor’s degree as do 86 percent of the 11,400 Chinese people of working age in Irvine, CA. The sheer size of the Chinese and Indian immigrant populations influences overall API averages on many socioeconomic indicators, masking some of the differences among the various populations within the API community and highlighting the importance of disaggregating by racial subgroups.
 
Asian and Pacific Islander communities cluster in Pacific Rim cities, but also inland cities like St. Paul
 
Of the 100 largest cities, New York City, San Francisco, and Los Angeles have the largest populations of Chinese people, while Long Beach, CA has the largest population of Cambodians followed by Philadelphia, PA and Stockton, CA. The cities with the largest Indian populations include New York City, San Jose, and Fremont, CA, while St. Paul, MN, Fresno, CA and Sacramento, CA have the largest Hmong populations. The Los Angeles and Seattle regions are home to the largest populations of Samoans outside of Hawaii while the San Francisco region has the largest population of Tongans. Explore the API subgroups more here.
 
People of Mexican, Puerto Rican, and Dominican heritage also cluster in certain cities
 
The immigrant to U.S.-born ratio for Latinos is basically the reverse of that for APIs. Nearly two in three of the 50.5 million Latinos are born in the U.S. Mexicans make up more than half of the total Latino population followed by “Other Latinos,” respondents who identified as Latino but did not specify a specific nationality or ancestry. The regions with the largest Mexican populations are in California and Texas while the regions with the largest populations of Puerto Ricans are located entirely in the east with the exception of Los Angeles (which ranked 15th). The city of Los Angeles is home to 14 percent of Salvadorans in the U.S., of which 35 percent are U.S.-born and New York City is home to 42 percent of the total Dominican population, 40 percent of whom are U.S.-born. Explore the Latino subgroups more here.
 
Data reveals differences within Black and White populations
 
Nearly 3.7 million people identified as non-Hispanic White with American Indian ancestry. This population is thus included in White averages and as a White subgroup but is 1.8 times larger than the total Native American/Alaskan Native (NAAN) population. Ten percent are located in Texas with 94,000 American Indian non-Hispanic White-identified people in the Dallas region alone. Aside from “Other Native American/Alaskan Native,” Cherokees make up the largest subgroup of the total NAAN population and more than 28,000 Cherokees live in the Tulsa region. Roughly 2.4 million non-Hispanic White people identified as Middle Eastern/North African (MENA). Seventeen percent of the MENA population lives in the Los Angeles region though the New York City, Chicago, and Detroit regions also have sizeable MENA populations. Eighty-six percent of Black/African Americans identified as “Other Black,” which is largely comprised of those identifying simply as “African American” to the ancestry question. Jamaicans were the next largest subgroup followed by Haitians. Well over half of the Jamaican and Haitian populations live in the New York City or Miami region.
 
We invite you to explore your city or region and look out next month for the release of socioeconomic indicators at the more detailed race/ethnicity level. Feel free to contact us with any questions or let us know how you’re using the data!

National Equity Atlas: March Update

Dear Equity Atlas users,

It has been an eventful couple of weeks! Since Leap Day, the Atlas has grown by three new indicators, been featured at the White House, and powered new data-driven stories about the economic imperative of equity in The AtlanticGrist, and elsewhere. Here is a recap:

New Data on School Poverty

  • The concentration of students of color in schools where most of their classmates are poor is a major driver of the achievement gap — and a critical indicator of whether communities are setting up their young people to succeed. Our new School Poverty indicator shares this data by race/ethnicity, grade level, and over time, from 2000 to 2014.
  • Ron Brownstein and his “Next America” team at The Atlantic used our data to investigate trends and solutions in the nation’s 100 largest cities, producing three stories: "The Concentration of Poverty in American Schools," "Separate and Still Unequal," and "Where Children Rarely Escape Poverty" (focusing on Charlotte).
  • Writer Alan Gottlieb drew on Atlas data to explore school poverty trends in Denver and Colorado Springs for The Colorado Trust’s blog.


New Data on Air Pollution

  • Decades of studies show that people of color are far more likely to live in polluted neighborhoods, leading to greater risks of asthma, cancer, and other health problems that hinder well-being and productivity. Last week, we added two indicators—Air Pollution: Exposure Index and Air Pollution: Unequal Burden—that measure the level of exposure to air toxics for residents as well as the extent to which a given demographic group shoulders a disproportionate burden of the area’s air pollution.
  • Grist’s Aura Bogado wrote about how these indicators reveal how race still trumps poverty when it comes to air pollution in “Money doesn’t matter: White people breathe cleaner air.
  • We presented these new indicators alongside the EPA’s EJSCREEN mapping tool on a webinar co-sponsored by the EPA and the APA titled “New Data Tools for Supporting Analysis of Equitable Development and Environmental Justice.” Watch it here.


White House Opportunity Project 

We added these new environmental indicators as a part of the White House Opportunity Project effort to “build digital tools that help families, community leaders, local officials, and the media to access what they need to thrive” based on open data provided by federal and local governments. Check out the other tools or read Tanvi Misra’s overview for CityLab.


Next Up: Disaggregating the Asian, Latino, and Black Populations

Now that those indicators are out, we’ve begun diving back into the data to work out our method for providing more detailed subgroup data for demographic and selected socioeconomic indicators. Stay tuned for a launch schedule.


Thank you for being a part of the movement to use data to build an equitable economy! Please take a moment to tell us how you are using Atlas data.

The National Equity Atlas team at PolicyLink and PERE

School Poverty Data Highlighted in The Atlantic


In a recent story in The Atlantic, Janie Boschma and Ronald Brownstein use new data from the National Equity Atlas to explore the racial concentration of school poverty. In “The Concentration of Poverty in American Schools,” Boschma and Brownstein note that in about half of the nation’s largest 100 cities, most Black and Latino students go to schools where at least 75 percent of all students qualify as poor or low-income. They write,

“This systemic economic and racial isolation looms as a huge obstacle for efforts to make a quality education available to all American students. Researchers have found that the single-most powerful predictor of racial gaps in educational achievement is the extent to which students attend schools surrounded by other low-income students.”

Percent of students by school poverty level: United States, 2014


The authors discuss the root causes of concentrated poverty as well as promising school integration models from Dallas and New York City as strategies to address these gaps. The Atlantic also cites the National Equity Atlas’s school poverty indicator in the stories “Separate and Still Unequal” and “Where Children Rarely Escape Poverty.”

Pages