Chart of the Week: St. Louis Wins Court Battle to Raise Minimum Wage

To add equity data to the national dialogue about growth and prosperity, every week the National Equity Atlas team posts a new chart from the Equity Atlas related to current events and issues.

On Tuesday, in a victory for working families, the Missouri Supreme Court upheld the city of St. Louis’s authority to raise its minimum wage to $11/hour by 2018. The decision reverses the 2015 ruling of a lower court judge who sided with business groups that sued the City in response to the ordinance. The Missouri Supreme Court judge who presided over the case reiterated that the city law does not conflict with state minimum wage laws: “[The state law’s] purpose of protecting employees is served by setting a floor for minimum wages; nothing in the law suggests the state also wanted to protect employers by setting a maximum minimum wage.” Although this ruling is a win for St. Louis workers, a separate 2015 state law prevents any other local jurisdictions from passing their own minimum wage increases, regardless of the local cost of living.

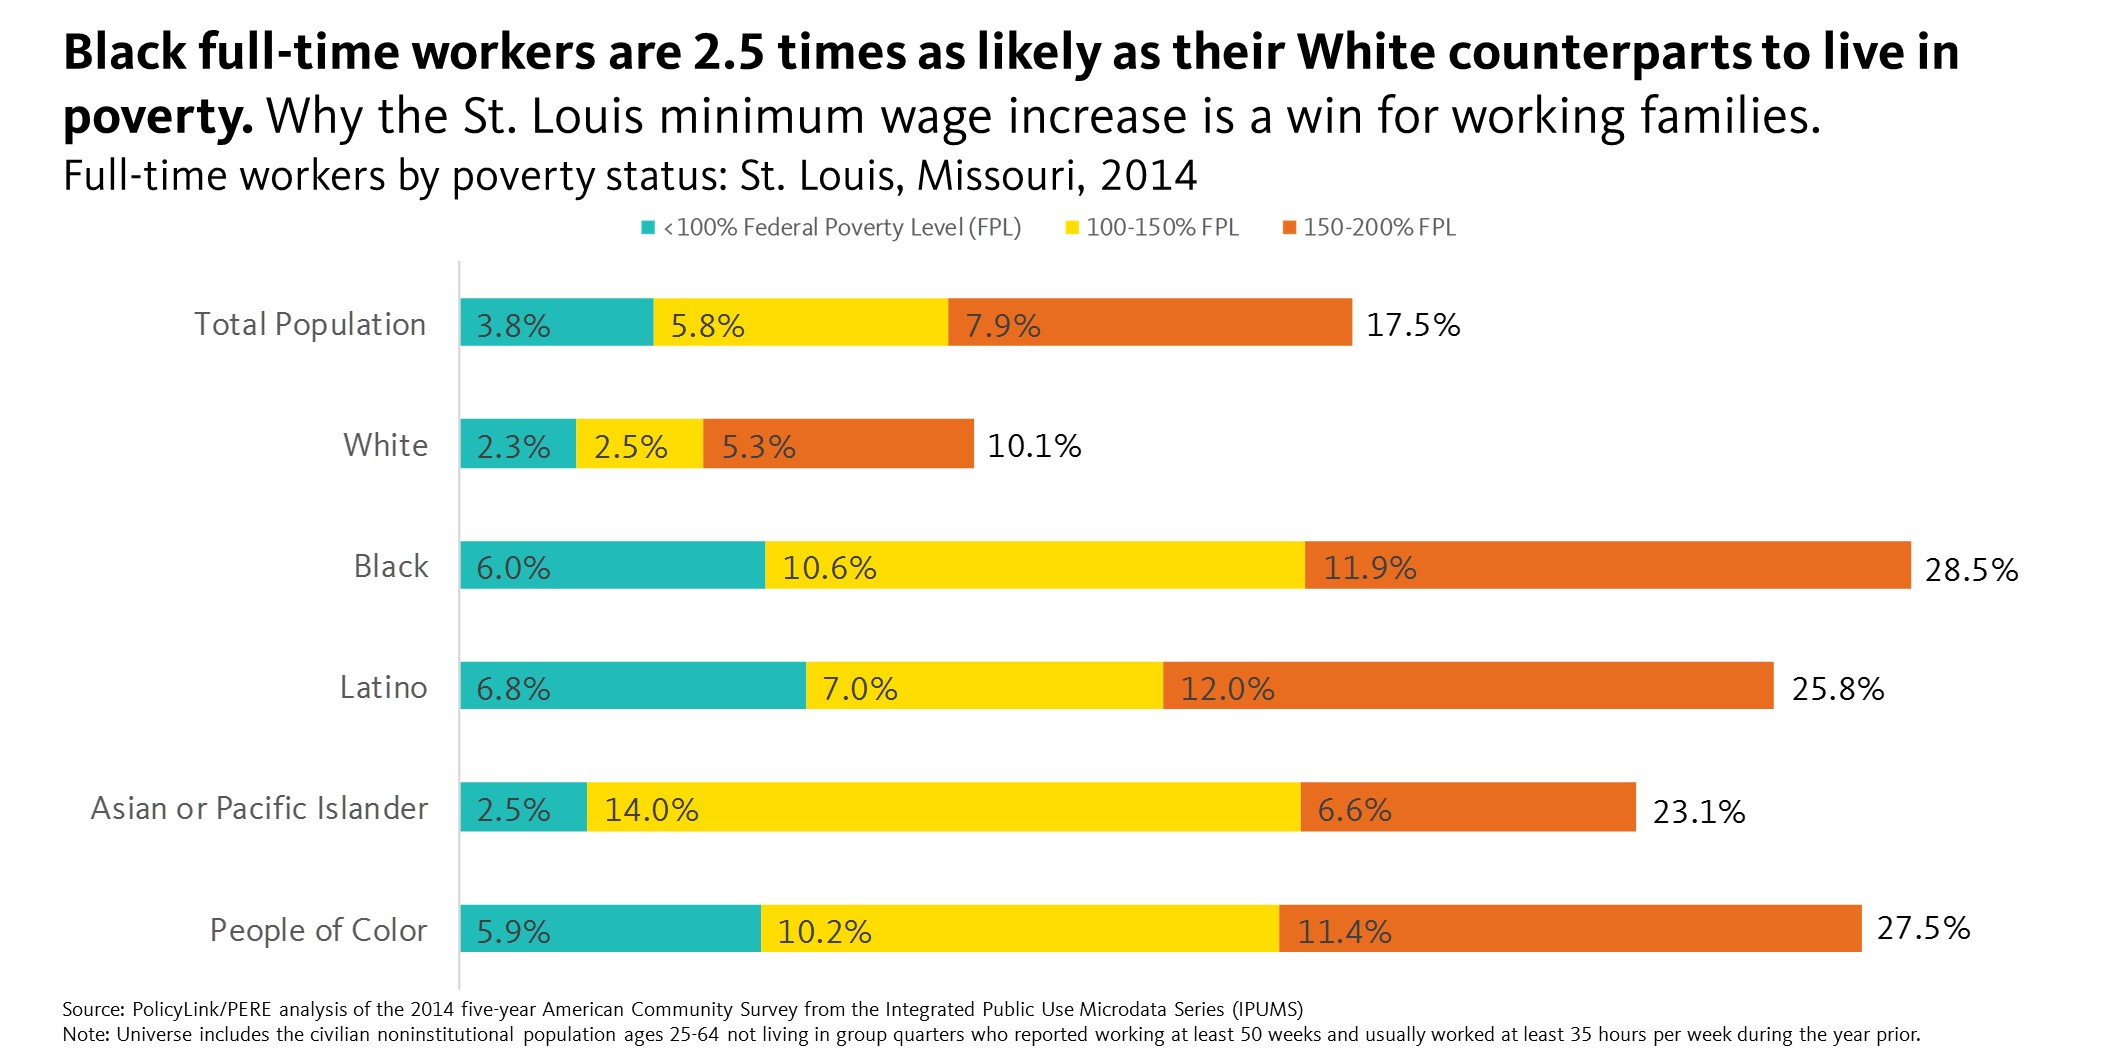
To highlight the importance of local minimum wages, this week’s chart looks at the share of full-time workers with a family income below 100, 150, and 200 percent of poverty in the city of St. Louis. As the chart below shows, nearly 29 percent of Black full-time workers ages 25 to 64 live below 200 percent of poverty compared with 10 percent of White full-time workers. Even more strikingly, nearly 7 percent of Latino full-time workers live below the federal poverty line compared with just over 2 percent of White full time workers. In other words, Black and Latino full-time workers in the city are 2.5 to 3 times more likely than White full time workers to live in poverty.

In a statement, St. Louis Aldermanic President Lewis Reed said, “Today, the Supreme Court justified our rights as a city to make sure the people in our city can make a living wage. The people of St. Louis need to be able to afford groceries for their families and a roof over their heads.” According to the MIT Living Wage Calculator, a living wage for one adult with two children in St. Louis is just over $25/hour, but this victory puts the city on the right path to ensuring that all full-time workers earn family supporting wages.

To explore policies that lift workers out of poverty, check out the Agenda to Raise America’s Pay and the Tax Alliance for Economic Mobility’s brief on utilizing tax credits for low-income workers.

To see how working poverty varies for your city, region, or state, visit the National Equity Atlas, download the chart and share on social media using #equitydata.

National Equity Atlas Air Pollution Data Featured in The Seattle Times

In a recent Seattle Times op-ed, Peter Bloch Garcia, executive director of Latino Community Fund of Washington, and Tony Leeco-chair of the Asian Pacific Islander Coalition in King County, used air pollution data from the National Equity Atlas to make the case for more equitable climate policies in Washington state.

"The National Equity Atlas illustrates that air-pollution exposure in the Asian Pacific Islander population is 34 points worse than it is for the white population in Washington state."

Urging state legislators to take action on climate and environmental justice, the authors explained that “While environmental justice champions at the federal level must play defense, Washington state should be on offense. We can rebalance uneven access to healthy neighborhoods and create green jobs.”

Visit the National Equity Atlas to learn more about our two air pollution indicators (Exposure index and Unequal burden) and explore the data for your region.

National Equity Atlas Update

Dear Equity Atlas Users,

The House of Representatives will soon bring its HUD funding bill for the remainder of FY17 to the floor for a vote, and Representative Gosar (Arizona-04) is likely to file an amendment that would dismantle the 2015 Affirmative Furthering Fair Housing (AFFH) rule and eliminate federal support for disaggregated geospatial data. This data is critical for communities and advocates to understand, track, and address racial inequities related to housing, employment, transportation, and many other important causes. Please join the National Fair Housing Alliance, PolicyLink, the ACLU Nationwide, and the National Low Income Housing Coalition and sign this letter encouraging Congress to protect AFFH and oppose any efforts to block access to federal geospatial data.

Race, Place, and Jobs: Reducing Employment Inequality in America’s Metros
Earlier this month Spotlight on Poverty and Opportunity featured a post from PolicyLink Senior Director Sarah Treuhaft, discussing how to build stronger and more inclusive regional economies by using neighborhood-targeted approaches to reduce racial inequities in employment. Read the full post and download the related brief here.

Addressing Racially Concentrated Unemployment: Lessons from New Orleans
U.S. unemployment rates have fallen across the board, but joblessness remains a pressing challenge for workers of color in many metros. Join the National Equity Atlas team on March 23 from 12:00 - 12:45 p.m. PT / 3:00 - 3:45 p.m. ET for a webinar discussion of our recent research brief, “Race, Place, and Jobs: Reducing Employment Inequality in America’s Metros,” and lessons from the Network for Economic Opportunity’s efforts to develop targeted solutions to unemployment in New Orleans. Register here.

Advancing Health Equity and Inclusive Growth in Sacramento County
On February 2, PolicyLink launched an engagement with the Healthy Sacramento Coalition to develop strategies to both promote racial equity and improve health outcomes for residents of Sacramento County. Founded in 2011 and supported by the Sierra Health Foundation, the Healthy Sacramento Coalition has grown to include more than 60 members actively working to address the social determinants of health. Sacramento is one of five cities where PolicyLink is working with partners to address racial inequities in health, with support from the Robert Wood Johnson Foundation. Coupling rigorous data analysis with the wisdom and experience of community leaders and residents, this engagement will yield a comprehensive equity profile that the Coalition will use to advance a focused policy agenda. The profile and report will be released in late April 2017.

Saving Federal Geospatial Databases and More Charts of the Week
Collecting and publishing disaggregated data is critical to advancing equitable growth locally, as illustrated in three recent charts of the week from PolicyLink Research Associate Ángel Ross.

  • The latest chart of the week, “Save AFFH and Federal Geospatial Databases,” highlights the importance of spatial data and the AFFH rule by showing two maps of unemployment in Memphis, Tennessee. The AFFH rule provides local jurisdictions with spatial data to ensure that federal dollars go towards making all communities neighborhoods of opportunity.
  • "Pittsburgh Mayor Peduto Signs Five Executive Orders," our February 17 chart of the week, looks at renter housing burden in the city of Pittsburgh.
  • Finally, our February 7 chart of the week highlights immigrants’ contribution to growth in Cincinnati – one of the newest cities to defy the president’s executive order on immigration and declare itself a sanctuary city. Immigrants in Cincinnati make up less than 5 percent of the population but have accounted for all of the city’s population growth since 1990.

Thank you!

The National Equity Atlas team at PolicyLink and the USC Program for Environmental and Regional Equity (PERE)

Chart of the Week: Save AFFH and Federal Geospatial Databases

To add equity data to the national dialogue about growth and prosperity, every week the National Equity Atlas team posts a new chart from the Equity Atlas related to current events and issues.

Last month, we wrote about the dangers of the proposed Local Zoning Decisions Protection Act of 2017, and this week we heard that the House of Representatives may bring its HUD funding bill for the remainder of FY17 to the floor for a vote next week. Representative Paul Gosar (Arizona-04) will likely file an amendment that adopts some or all of the language in the bill.

The National Fair Housing Alliance, PolicyLink, the ACLU, and the National Low Income Housing Coalition have coordinated to prepare a sign on letter in opposition to Rep. Gosar’s expected amendment. CLICK HERE to read and sign on to the letter, and please share with your local, state, and national networks! The deadline to sign on is Tuesday, February 28.

As letter describes, even though the Fair Housing Act has been on the books for nearly a half century, cities, counties and states that receive federal funds for housing and community development had little guidance about how to fulfill the fair housing obligations to which they agreed in exchange for receiving those funds, and few tools for doing so. The 2015 Affirmatively Furthering Fair Housing (AFFH) rule responds to requests from HUD grantees for greater guidance and more support in furthering fair housing, as well as recommendations made by the Government Accountability Office in a 2010 report based on its review of HUD’s fair housing oversight.

This week’s chart highlights the importance of spatial data and this rule in particular by showing two maps of unemployment in Memphis, Tennessee. The map on the left shows white unemployment by neighborhood and the map on the right shows unemployment for people of color by neighborhood. The darker blue census tracts represent areas where the unemployment rate is more than 20 percent. On the white unemployment map, there are only a few neighborhoods where unemployment is higher than 20 percent but on the people of color map, there are several clustered throughout the city. Racial differences in employment result from differences in education, training, and experience as well as barriers to employment for workers of color such as English language ability, immigration status, criminal records, lack of transportation access, and racial discrimination and bias among employers and institutions. The AFFH rule provides local jurisdictions with spatial data like this to ensure that federal dollars go towards making all communities neighborhoods of opportunity.

Please consider signing on the letter and sharing it with your local, state, and national networks and share on social media why you oppose amendments to the T-HUD bill that would repeal HUD’s Affirmatively Furthering Fair Housing (AFFH) regulation, require HUD to use its limited resources to duplicate previous consultations with state and local governments about how to fulfill their fair housing obligations, and block public access to government geo-spatial data.

To see how unemployment varies in your city, region, or state, visit the National Equity Atlas and share the map of your community using #equitydata.

Chart of the Week: Pittsburgh Mayor Peduto Signs Five Executive Orders on Affordable Housing

To add equity data to the national dialogue about growth and prosperity, every week the National Equity Atlas team posts a new chart from the Equity Atlas related to current events and issues.

Pittsburgh Mayor Bill Peduto signed five executive orders last week aimed at preserving and expanding affordable housing in the city. The Affordable Housing Task Force, which developed a list of housing policies the City could enact to prevent the displacement of long-time residents and to mitigate the effects of the rapid development occurring throughout the city, informed the executive orders.

After decades of depopulation and a stagnant economy, Pittsburgh is coming back. Once dominated by the steel industry, the city is now becoming a knowledge and technology-driven economy. Young college graduates are moving to Pittsburgh and enjoying the emerging startup culture and opportunities arising from the redevelopment of the city — but many longtime residents and local businesses are not benefiting from Pittsburgh's resurgence. Some neighborhoods are gentrifying, rents and home prices are rising, and families are moving out of the city to the suburbs to find affordable housing options. At the same time, in this emerging market, other neighborhoods continue to await long-needed reinvestment.

Mayor Peduto's executive orders are a good first step to ensuring that everyone in Pittsburgh, especially long-standing residents, can benefit from the city's development. This week’s chart looks at renter housing burden in the city of Pittsburgh. Renter housing burden refers to the share of renter households spending more than 30 percent of household income on housing costs. Approximately 50 percent of renters in the city of Pittsburgh are cost-burdened. But, the burden is experienced differently among different racial groups. Nearly 54 percent of Black renter households are cost-burdened, compared with 47 percent of White renter households. Households of color are also significantly more likely than White households to be renters. Only 32 percent of households of color are owner-occupied compared with 56 percent of White households.

Housing is one critical component of a strong equitable development agenda. Policies that preserve and expand affordable housing options and ensure that all residents can stay in their community and benefit from redevelopment are critical to the health of a city's economy. To learn more about the work of PolicyLink and Pittsburgh partners to advance an equitable development in the city, check out “The Path to an All-In Pittsburgh.”

To see how renter and homeowner housing burden varies in your city, region, or state, visit the National Equity Atlas, type in your community, and share the chart using #equitydata.

Pages