Fact Sheets: Renter Week of Action
The Renter Week of Action fact sheets are two-page PDF documents that could be printed as double-sided handouts. They provide data, a framing narrative, and policy solutions regarding rent burden at the national level and the local level for 37 cities. While the local fact sheets share the same framing narrative and policy solutions, they provide customized data specific to each city. solutions.
The following visual highlights several key design elements we used in the strategic design of this dashboard. Click on the questions below to explore more about our approach to designing this dashboard.
Key Design Highlights
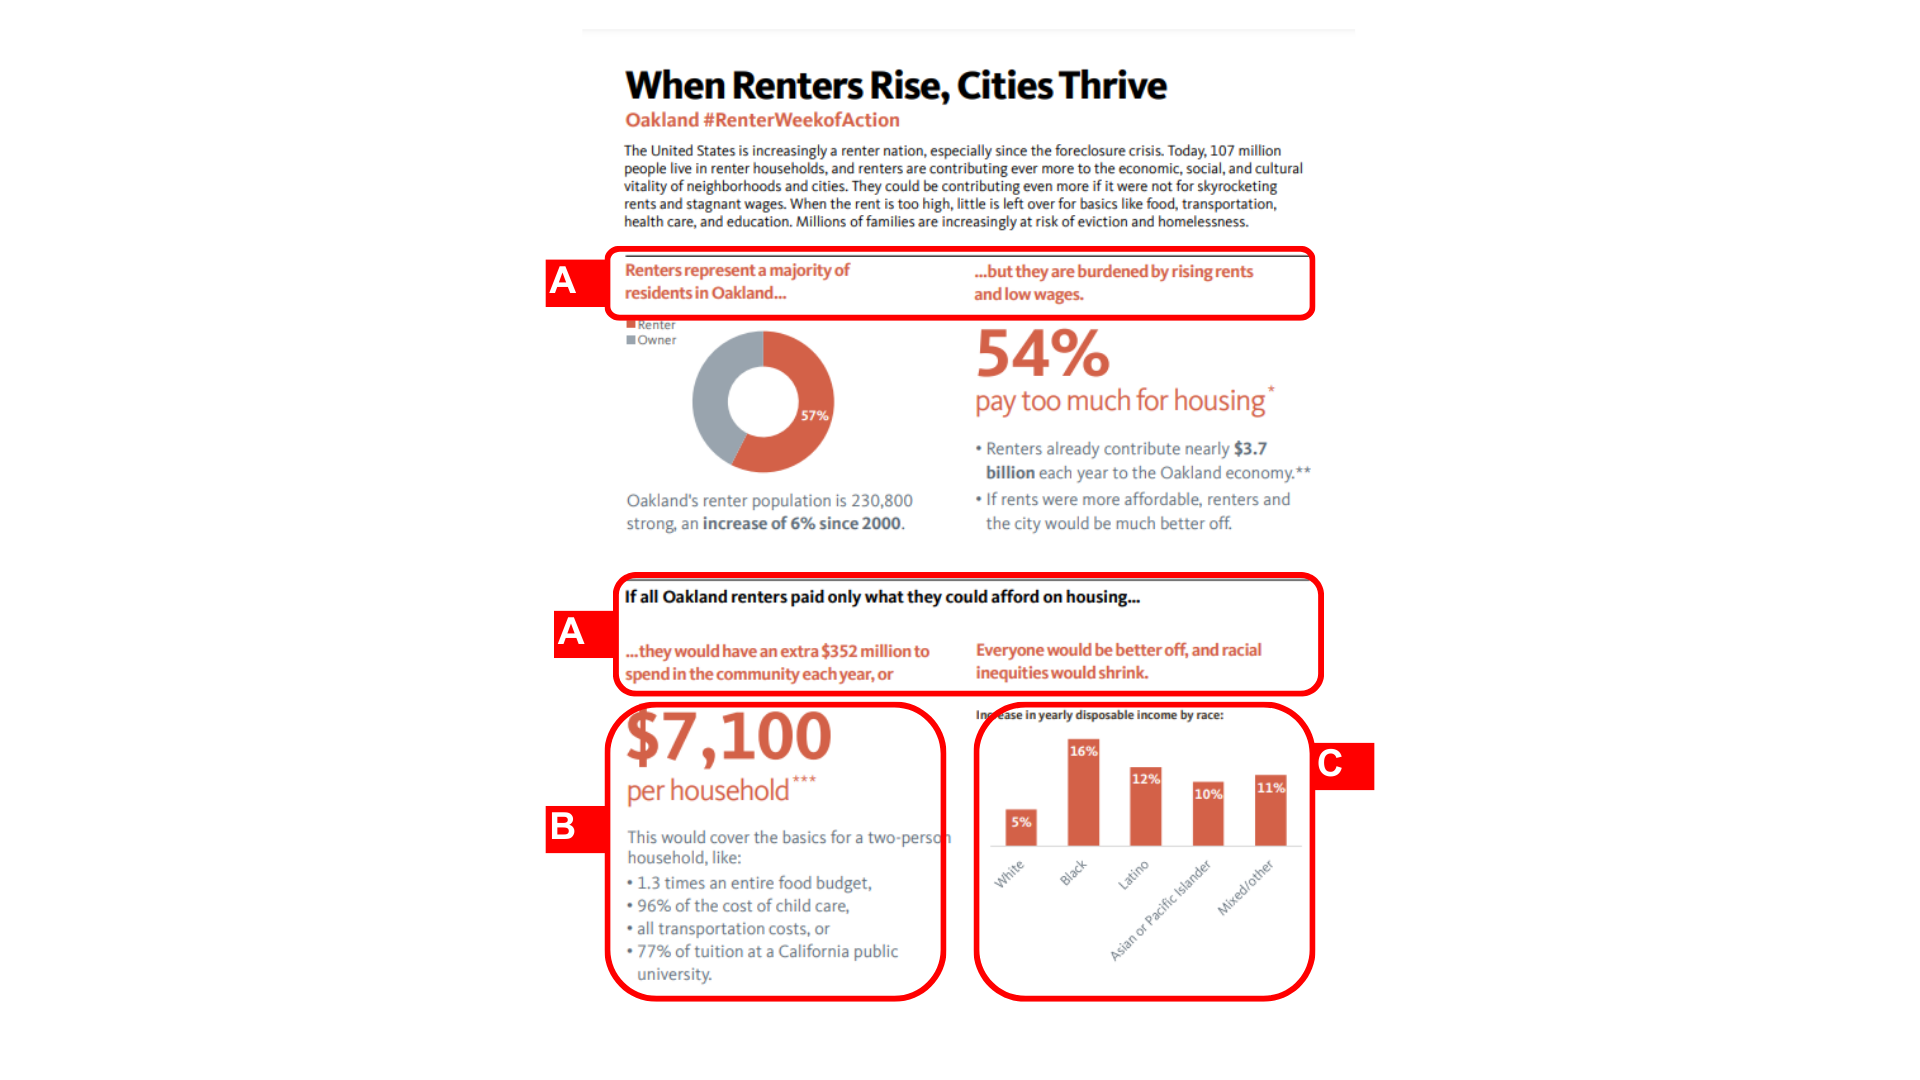
(A) Bold headers that provide the overall narrative frame
(B) Supporting text that helps users put the listed dollar amount into context by relating it to common household costs
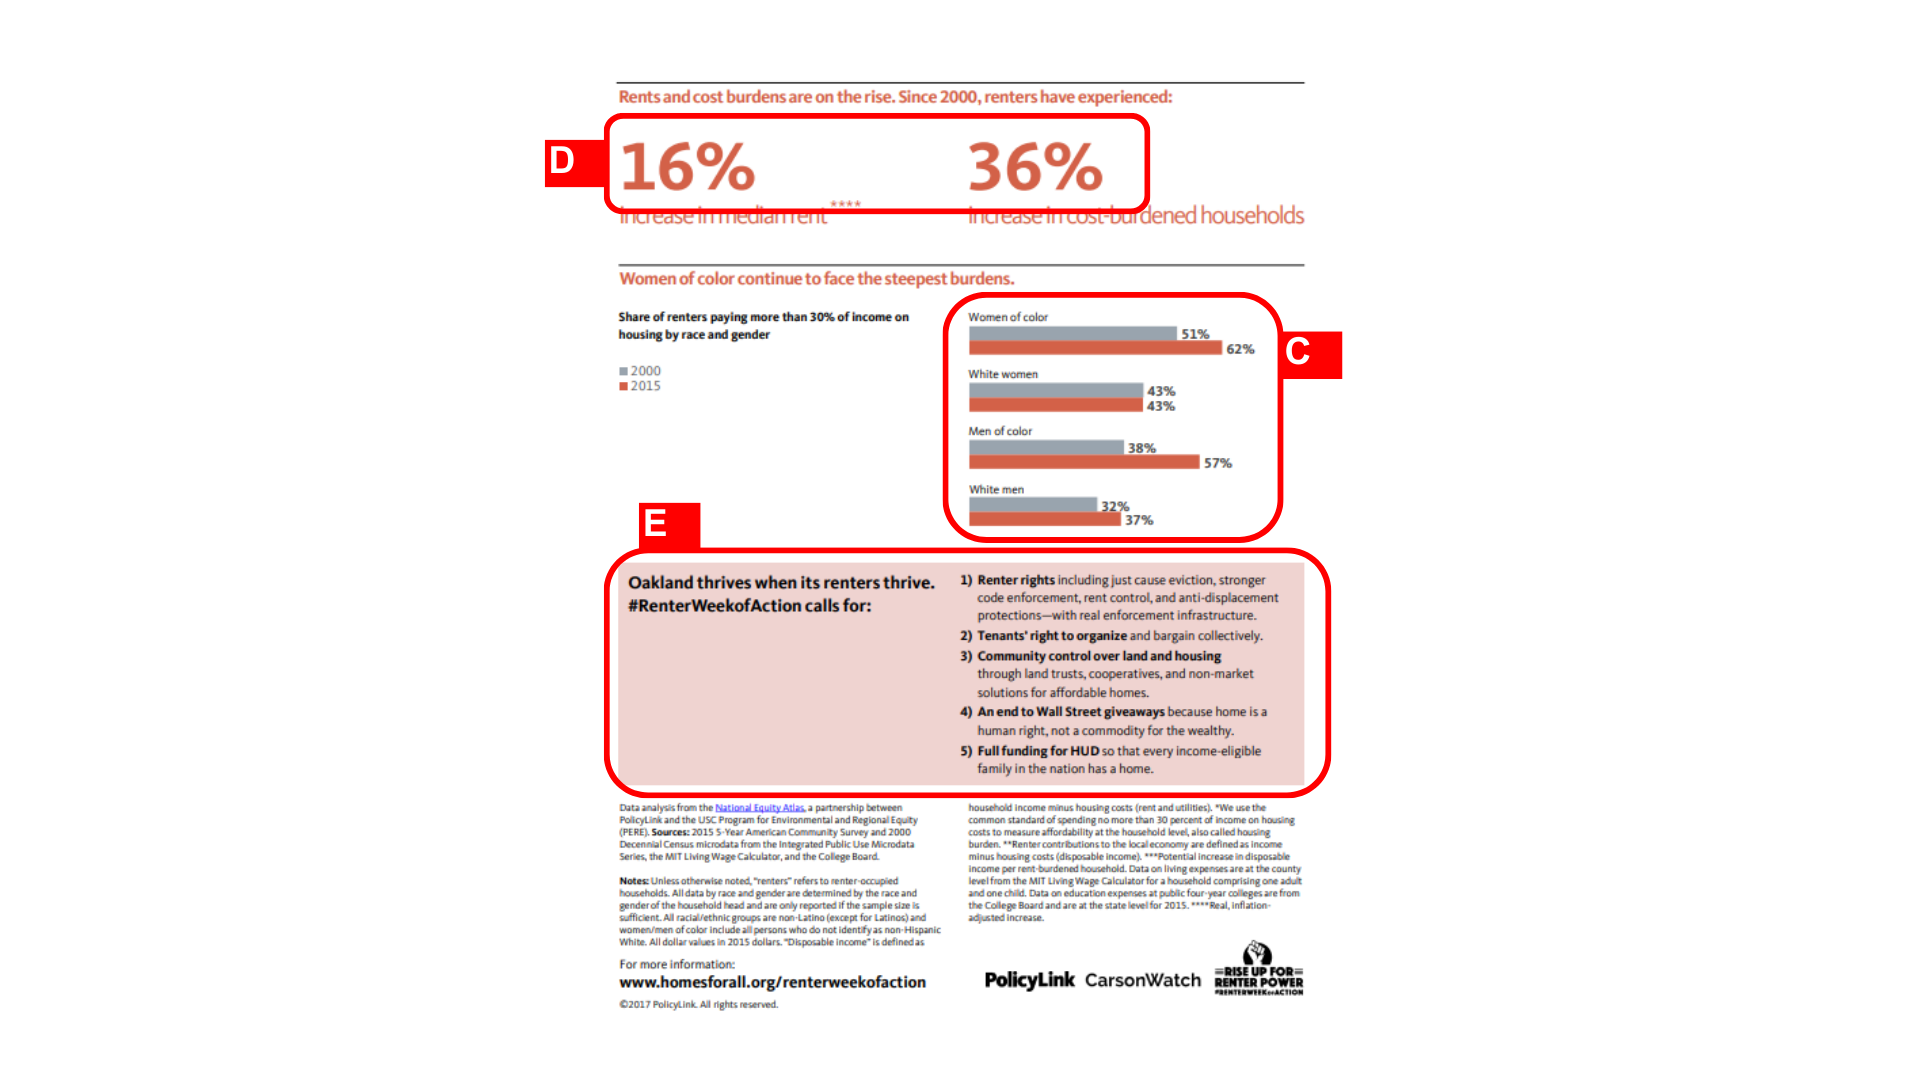
(C) Charts that provide disaggregated data and show differences between groups
(D) Large-font numbers that distill quantitative data into accessible bits to improve the fact sheet’s overall readability
(E) Calls to action and policy solutions that direct readers to the #RenterWeekofAction campaign goals
Who were the fact sheets created in partnership with?
The fact sheets were created with our partners at Homes for All, a program of the Right to the City national alliance. They were released in September 2017, as part of the #RenterWeekofAction campaign. The fact sheets were shared via email and social media, and they were posted on our website. We also listed other resources online, including the #RenterPower Action Toolkit, to help people across the US find and participate in local actions.
Who were the fact sheets created for?
The fact sheets were created for housing advocates to use in the outreach and advocacy activities that they undertook as part of the #RenterWeekofAction campaign. The fact sheets were also created as an open invitation for all housing advocates to participate in the campaign.
What was the intended use of the fact sheets?
The fact sheets were created in support of the #RenterWeekofAction campaign. To develop them, we analyzed the impact of the growing housing affordability crisis in the US and 37 cities. We found that US renters would have $124 billion extra to spend in their communities every year if they paid only what was affordable for housing. That amount translated to an additional$6,200 per rent-burdened household (renter households that spend more than 30 percent of their income on housing costs). The national and city-level fact sheets included data on rent burden and highlighted how stronger policies could protect and support renters.
What data is included in the fact sheets?
The fact sheets use data from the 2015 5-Year American Community Survey and 2000 Decennial Census microdata from the Integrated Public Use Microdata Series (IPUMS), the U.S. Department of Agriculture (USDA), Care.com, the U.S. Bureau of Labor Statistics, and the College Board.
What was the design approach?
The fact sheets were designed to be double-sided, one-page handouts that advocates could easily print on standard 8.5-by-11 paper. The one-sheet handouts could be easily distributed to policymakers and community members as part of outreach activities. The fact sheets were crafted to support advocacy by providing relevant data, a framing narrative, and targeted policy solutions. The fact sheets also supported outreach and education efforts by providing a clear, nuanced narrative to help readers understand issues related to housing affordability and why specific policies were important.