Co-Develop Community Data Tools with the National Equity Atlas

A Request for Letters of Interest to Partner with the National Equity Atlas to Co-Develop Community Data Projects (PDF)

Across the country, local organizations are leading collaborative, cross-sector efforts to advance equity-driven strategies for inclusive prosperity. Data disaggregated by race, geography, and other demographics is foundational to their efforts, both to build a shared narrative about how and why equity matters to their community’s future and to inform community action and measure progress toward results. When informed by the voice, wisdom, and experience of those most impacted by structural racism and systemic bias, data projects can empower collective action, guide decision-making, undergird advocacy, and inform policy development and investment.

The National Equity Atlas team at PolicyLink and the Program for Environmental and Regional Equity at the University of Southern California (PERE) invite local partners working in the ten priority communities of the W.K. Kellogg Foundation to submit proposals to work with our team on data projects to inform their equity initiatives.[1] This opportunity builds on the series of community equity profiles we produced in 2017 and focuses on supporting local leaders in developing more effective data-driven narratives, community-owned data projects, and knowledge products that strengthen and accelerate their equity efforts.

Over the next two years, we will partner with five community organizations or collaboratives to co-develop data projects that advance equitable growth strategies locally. We can support three types of data projects.

  • Customized online equitable growth data dashboards. These interactive dashboards would include a set of 5-7 locally-prioritized indicators for monitoring progress on equitable growth, along with a narrative framing the data and solutions being advanced by the community partners. They would include indicators of demographic change, economic equity, transportation justice, housing, education, or other indicators for which data are available via the National Equity Atlas/our equity indicators database (see the “Data and Methods” page). We could possibly include 1-2 indicators from local sources depending on availability and need. Example: Data Summaries page on the National Equity Atlas.


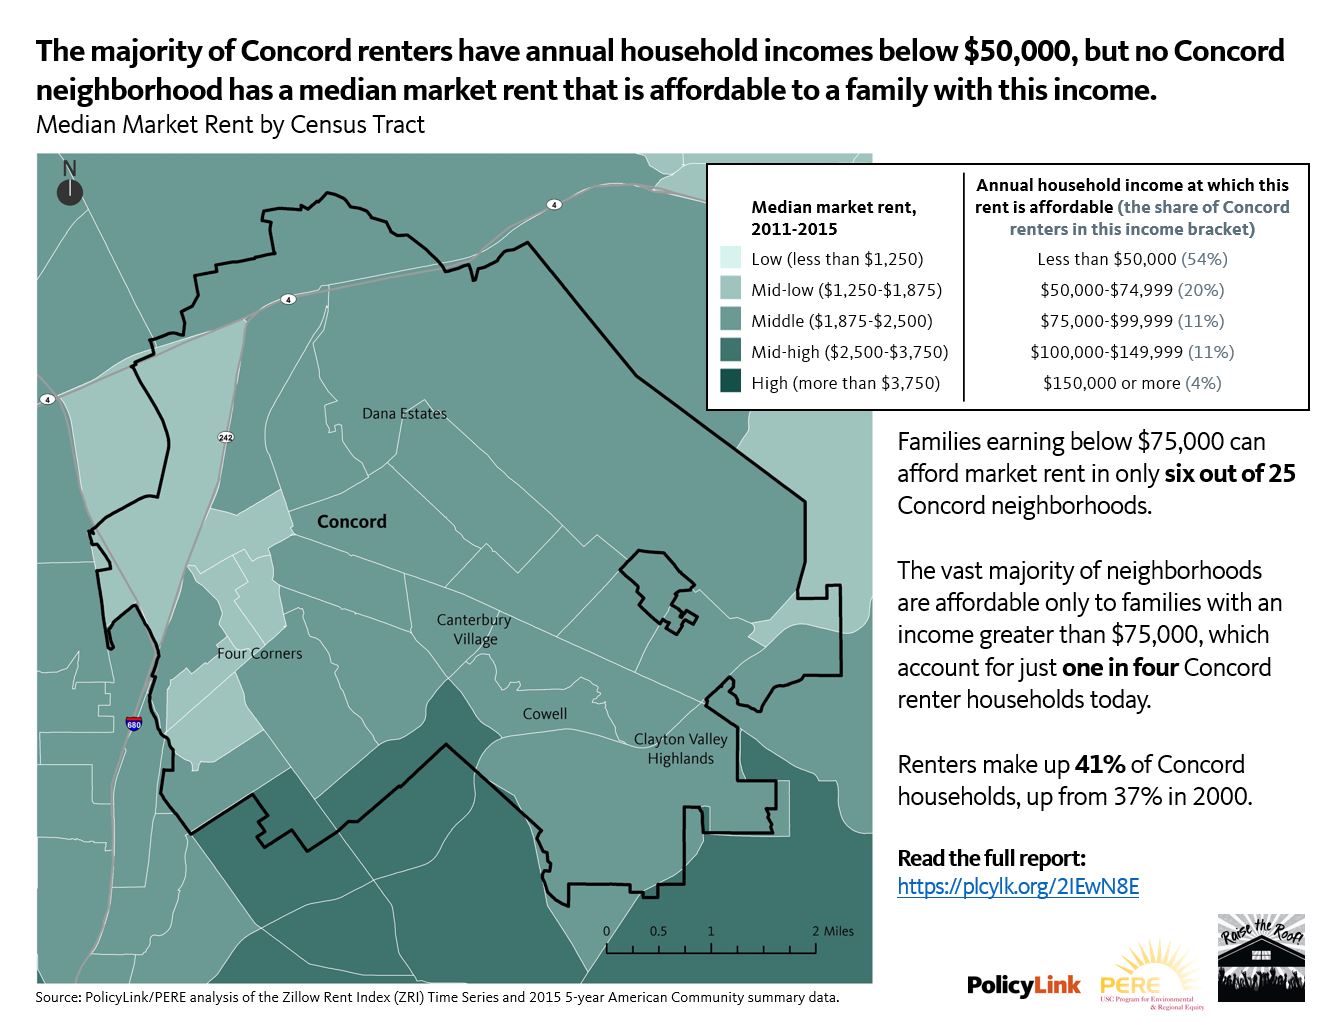
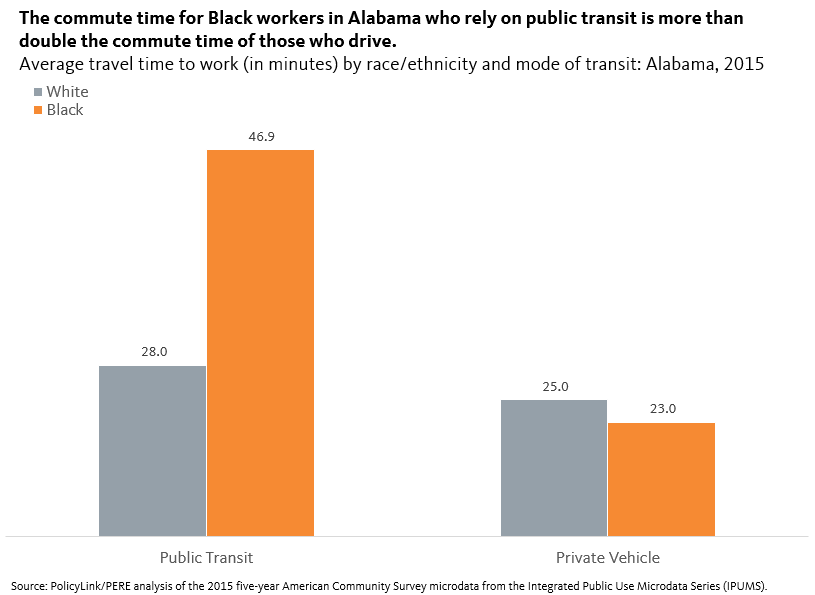
  • Responsive data analyses to support policy campaigns related to housing, health equity, equitable development, and economic security. These analyses could be a series of short and sharable fact sheets or infographics that frame an issue with local data in support of a campaign. They might include data for a series of geographies ranging from the county or regional-level down to the neighborhood or provide data across a set of issues like housing affordability or employment equity. Example: Renter Week of Action fact sheets.


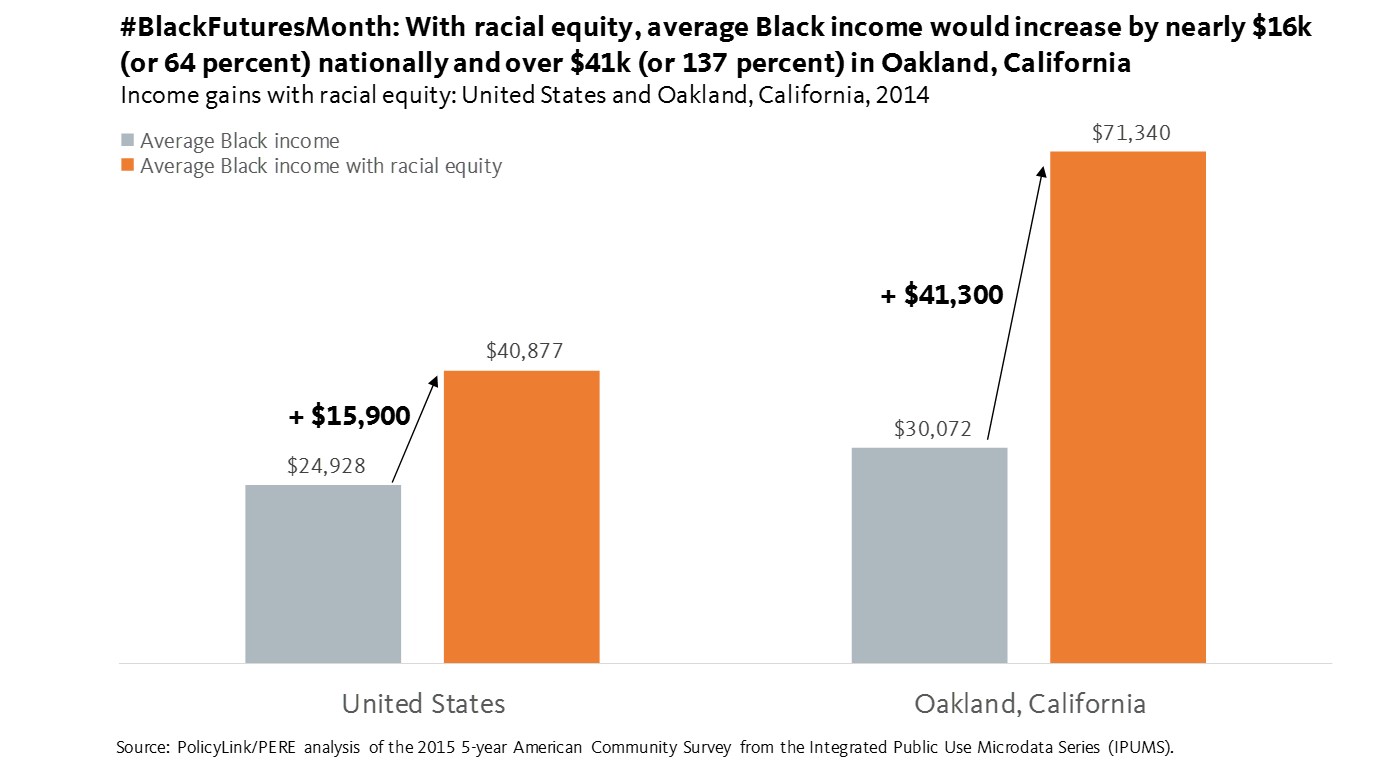
  • Data-driven narratives to make the case for racial and economic equity. This could be a short report or a web page detailing the economic imperative of racial equity, providing key indicators, and highlighting effective strategies and policies to achieve equity. Example: California’s Tomorrow.


Prospective applicants are encouraged to propose tools that support efforts to drive policy and systems changes that advance racial equity and inclusive growth in their communities. For more examples of existing tools developed in partnership with community organizations, please visit the National Equity Atlas at http://nationalequityatlas.org/reports. Also see our report presenting 10 design principles for health equity data tools.

The National Equity Atlas team will work with a lead community-based organization or collaborative in five of the priority communities over a six-month period during 2018-2019 to co-design a data product and engage other community partners in the process. We seek local partners who are interesting in producing this tool or analysis to inform their policy work and raise their profile on equity policy issues. During the tool development process, community partners would be asked to:

  • Offer an initial vision for a data tool or product (through this application);
  • Co-develop the tool or analysis with the National Equity Atlas team;
  • Convene other local organizations, leaders, and residents to inform the design and development of the tool;
  • Regularly communicate with the National Equity Atlas team via email, phone, and videoconference;
  • Lead the planning of a local release event to share the produce more broadly with community leaders, policymakers, business leaders, and the media; and
  • Participate in two brief survey assessments to help gauge the effectiveness of the project, shortly after the tool’s release and one year after the release.


About the National Equity Atlas

The National Equity Atlas (www.nationalequityatlas.org) is a comprehensive online resource that shares indicators of demographic change and economic equity for 301 different U.S. geographies (the 100 largest cities, 150 largest regions, all 50 states, and nationwide). Maintained through a partnership between PolicyLink and the USC Program for Environmental and Regional Equity (PERE), the Atlas draws on a unique indicators database that incorporates hundreds of data points from public and private data sources and includes historical data as well as demographic projections through 2050. Through timely analyses, reports, and blog posts, the Atlas provides local leaders with data to track, measure, and make the case for inclusive prosperity.

Submission Deadline and Selection Process

There will be two informational webinars about the project, where interested partners can learn more about the types of tools and analyses that the Atlas team has produced and ask any questions related to the project.  These webinars will take place on Thursday, May 3 at 12pm PT/3 pm ET and Friday, May 4 at 12pm PT/3 pm ET. The Atlas team is also available to vet project ideas with community partners.

Organizations interested in this opportunity should complete the online application by May 25, 2018 to be considered. Please direct all questions to James (james@policylink.org) via email, specifying “Data Tool LOI Question” in the subject line.

PolicyLink and PERE will review and evaluate all applications and select two projects to work on in mid-2018 and three projects to work on in early 2019. All applicants will be notified if they are selected by June 8, 2018.

Selection Criteria

Proposals will be evaluated based on the following criteria:

  1. Potential to support community-driven policy and systems change to advance racial and economic equity. We are looking for data projects that aim to leverage data to influence public policy, resource allocation, and decisionmaking. This includes all points in the policy process from informing and framing the debate to monitoring progress toward equity results. We seek partners that have a track record of building inclusive coalitions that advance equity solutions.
     
  2. Potential to build community power and capacity. We are looking for data projects that engage impacted communities in the tool development process and increase community capacity to influence the policy debate by strengthening their use of data to track, measure, and make the case for equity solutions. We believe that communities that bear the brunt of inequities should be at the forefront when creating data tools, both to inform tools with community knowledge and ensure tools meet community needs and aspirations. We are looking for projects and partners that will undertake this data project in a way that engages communities of color, low-income communities, and other vulnerable populations, such as the transgender and/or disabled community, in the process

In addition, we will consider the diversity of places, projects, populations of focus, and levels of community data capacity across the five projects.

Download this request for letters of interest as a PDF.

[1] The ten priority communities are: Albuquerque, NM; Farmington, NM; Las Cruces, NM; Detroit, MI; Battle Creek, MI; Grand Rapids, MI; Jackson, MS; Sunflower County, MS; Biloxi, MS; and New Orleans, LA

Is Any Bay Area Neighborhood Affordable to Low-Income Families? A Look at San Jose and Concord (Hint: No)


On April 10, we released “Solving the Housing Crisis Is Key to Inclusive Prosperity in the Bay Area” in partnership with The San Francisco Foundation. The report underscores the relationship between housing and economic insecurity, and the threat that the housing affordability crisis poses to the region’s economic sustainability. The central analysis draws on neighborhood-level Zillow rent data and shows that a family of two full-time workers making $15/hour can afford the median market rent in only 5 percent of the 9-county Bay Area’s 1,500-plus neighborhoods. The vast majority (92 percent) of these affordable neighborhoods are rated “very low” in opportunity on a comprehensive index of neighborhood opportunity from diversitydatakids.org.

To show how these dynamics are playing out in two Bay Area cities, we teamed up with Working Partnerships USA in San Jose and the Raise the Roof coalition in Concord.

More than half of renters in San Jose today pay too much for housing, defined as paying more than 30 percent of their income on housing costs. Not a single neighborhood in the city has a median market rent affordable to a family with two $15/hour workers. In fact, it would take an annual income of at least $70,000 to be able to afford market rent. To view the full fact sheet from Working Partnerships, click here.

Sixty miles north of San Jose is the city of Concord. Located in East Contra Costa County, Concord is a more suburban city with a median household income lower than San Jose but higher than Oakland. Renters make up 41 percent of households and most renter households have annual incomes below $50,000. Yet no Concord neighborhoods have a median market rent affordable to families with an annual income less than $50,000. And only six neighborhoods in the city are affordable to families with incomes up to $75,000. The majority of Concord neighborhoods require an annual income greater than $75,000. For more information about the Raise the Roof campaign, click here and visit their Facebook page.

Solving this crisis won’t be easy, but we recommend comprehensive housing solutions (including protection, preservation, inclusion, and production), building renter and community power, and increasing economic security. In San Jose, Working Partnerships are working to stop illegal utility charges by preventing landlords from using Ratio Utility Billing Services (RUBS) to increase rents, to add protections for immigrants under just cause eviction, and to stop unfair evictions and harassment of tenants by opposing a redundant and discriminatory “criminal activity” policy. In Concord, Raise the Roof is ramping up efforts on a campaign for more tenant protections. Follow their Facebook page for the latest announcements.

For the full report on the Bay Area housing crisis, visit PolicyLink.org or http://www.policylink.org/resources-tools/solving-housing-crisis-bay-area.

SaveSave

SaveSave

Chart of the Week: Alabama Transit Justice

To add equity data to the national dialogue about growth and prosperity, every week the National Equity Atlas team posts a new chart from the Equity Atlas related to current events and issues.

This week we are highlighting the importance of public transportation in connecting low-income residents and people of color to quality jobs. In cities and regions across the country, rapidly increasing housing costs and stagnant wages have forced many residents to move further away from the urban core in order to find affordable housing options. As a result, these residents must navigate a “spatial mismatch,” or making choices between neighborhoods with affordable housing or with employment opportunities that pay family-sustaining wages. This spatial mismatch can be a barrier to employment for many, particularly those reliant on public transit.

Over the last year, PolicyLink and PERE have been working with nonprofit partners in Alabama, Mississippi, Georgia, North Carolina, and Louisiana as part of a project to advance employment equity in southern states. The disparities in commute time in Alabama illustrate how important access to public transportation is in leveling the playing field for having access to quality jobs. Alabamians who travel to work in a private vehicle have comparable commute times regardless of race. However, those residents that get to work on public transit have a markedly different commute. The commute time for Black Alabamians is almost 20 minutes longer than that of their White counterparts.

Alabama is one of only five states that provide no state funding to supplement federal and local transportation funding. Without any state investment in the public transportation infrastructure, transit operators have been forced to cut service to certain neighborhoods and steadily increase fares in order to make necessary repairs. This lack of connectivity also further isolates rural residents and hinders their ability to access employment centers. Given that people of color are more likely to rely on public transit to get around in Alabama, disinvestment and underfunding of the state’s bus systems creates an additional barrier to employment and achieving economic security.   

Thankfully, there are policy alternatives that could enhance the public transit infrastructure in Alabama. Advocates there are promoting a public transportation trust fund to supplement the federal allocation that the state receives. The legislation recently passed the state house of representatives and is currently pending approval in the state senate.

To see the average commute time for your community, visit the National Equity Atlas and type in your city or state. Download and share the chart on social media.

National Equity Atlas: February Update

Dear Atlas users:

Greetings from the National Equity Atlas team! We have been busy updating all of our indicators and are excited to share this new data with you. We are also relaunching our Chart of the Week series adding equity data to the discussion about current events and issues. And we welcomed two new staff to our team: Jamila Henderson, a senior associate at PolicyLink, and Edward Muna, a data analyst at PERE, who you can expect to hear more from in the coming weeks.

Access 2015 Data for Your Community
In September, $201 billion: That's the potential economic boost that the Houston metro economy could have gained in 2015 if there were racial equity, up from $165 billion in 2010. Go to the Atlas to get this data point - and many more - for your community. Most of our 34 indicators are now updated to reflect the latest Census microdata release (the 2011-2015 pooled data from the American Community Survey), and in many case you can see change over time between 2000, 2010, and 2015. Visit http://www2.policylink.org/e/78532/indicators/681q6h/356661236.

Join Our Team this Summer!
PolicyLink is accepting applications from current graduate students for a full-time Equity Atlas summer internship in our Oakland office. Help us produce new equity analyses and build new community equity data tools with partners in the Bay Area, Buffalo, Louisiana, or elsewhere. Apply here by March 9 and share this opportunity with your networks.

Equity Data Informing Community Action in Battle Creek
Last week, the Atlas team was in Battle Creek, Michigan presenting the findings from the Battle Creek Equity Profile to leaders of the BC Vision initiative during their steering committee retreat. We were happy to share data insights and support the group as they worked with the Kellogg Community College Center for Diversity and Innovation to more deeply embed an equity approach throughout its efforts to build an equitable, thriving city.

Chart of the Week: #BlackFuturesMonth
For the final week of Black History Month/Black Futures Month, Atlas team member Ángel Ross of PolicyLink analyzed the gains in Black income nationally and in Oakland, California if the vision of racial equity were achieved—if we lived in a society where all Black people can participate, prosper, and reach their full potential.

In the News…
In an article for Los Angeles Times, L.A. Tenants Union member Tracy Jeanne Rosenthal uses "An Equity Profile of Los Angeles Region" in her opinion piece arguing that planning for transit and affordable housing should focus on the needs of low-income tenants of color, not the production of units, writing, "Without adequate protections to keep low-income tenants in their homes, transit-oriented development might as well be called transit-rider displacement."

Thank you!

The National Equity Atlas team at PolicyLink and the USC Program for Environmental and Regional Equity (PERE)

Chart of the Week: #BlackFuturesMonth

To add equity data to the national dialogue about growth and prosperity, every week the National Equity Atlas team posts a new chart from the Equity Atlas related to current events and issues.

Just in time to celebrate the culmination of Black History Month and Black Futures Month, the National Equity Atlas team is thrilled to relaunch the Chart of the Week series. This week, we are honoring the reality of Black existence and Black joy. Our vision of equity is a society where all Black people can participate, prosper, and reach their full potential. To put a dollar amount to the potential gains for the Black population if this vision of equity were achieved, we compared actual Black income to a scenario of racial equity in income for the population ages 16 and older.

Nationally, average Black income was $24,928 in 2015 (as the chart below details). But if Black people had the same age-adjusted income distribution as non-Hispanic Whites, average Black income would be nearly $41,000, an increase of 64 percent. In the City of Oakland, California, average Black income was $30,072 in 2015. But with racial equity, this number would have been over $71,000, a staggering 137 percent increase. The potential gains in Oakland are substantially higher than the national gains because average White income in Oakland is nearly double the average White income nationally. But average Black income in Oakland is just $6,000 more than average Black income nationally, despite being in one of the most expensive metro areas in the country.

Closing racial gaps in wage and employment can be achieved by eliminating discrimination in pay and hiring, boosting educational attainment, and ensuring strong and rising wages for low-wage workers. Policies that focus on these goals are good for families, good for communities, and good for the economy. National Equity Atlas data show that in Oakland, income gains for the Black population are evenly split between an increase in wages and employment, which we measure by the number of hours worked. Strategies that address both factors include ending wage theft and strengthening workers’ rights to organize as well as helping Black entrepreneurs start and scale-up their businesses. With racial equity in wages and employment, Black families would have more money to not just survive, but thrive and plan for the future.

To see the newly updated gains in Black income with racial equity for your community (we just released the 2015 data!), visit the National Equity Atlas and type in your city or state. Download and share the chart on social media using#BlackFuturesMonth and #equitydata.

Pages