Introducing the Policing in Schools Indicator: How to Use this Data
At the national level, the Civil Rights Data Collection (CRDC) data set, like many federally collected datasets, provides a critical view of students’ experiences across the United States. The federal Department of Education establishes laws to protect students’ rights so every child has equitable opportunities to succeed. Although the CRDC is administered biennially, school closures from COVID-19 delayed the 2019–20 cycle. As districts continue to see the impact of the pandemic on enrollment and data collection, the Policing in Schools Indicator uses 2017–2018 data, the most recent reliable dataset available at the time of our analysis.
By providing a template and guidelines for districts and states to collect quantitative data, this federally administered dataset enables policymakers, researchers, and advocates to understand national school discipline trends and inequities. One such analysis by the National Black Women’s Justice Institute examined national disciplinary trends among girls in public schools across four school years (2011–2018) and revealed that Black girls were the only group of girls to be overrepresented in every category of disciplinary action.
Using the new Policing in Schools Indicator on the National Equity Atlas, users can explore student arrest and referral figures by race/ethnicity, gender, classroom size, and grade level across all geographies available on the Atlas.
How to Use This Data
You can use this Indicator to explore questions such as:
What It Shows
The above chart displays the number of school-based arrests in the US during the 2017–2018 school year, broken out by school level (high, middle, primary, and “other,” as defined by the CRDC). The colors correspond to the school level type, and the size of each section of the donut reflects that school level’s share of the total arrests. Using this data, users can both visualize relative comparisons, such as the level at which most arrests are concentrated (e.g., high schools), and the exact number of arrests included in the chart’s labels (e.g., 33,720).
What It Shows
The chart shows the arrest rate in the US across high schools, disaggregated by race/ethnicity (calculated as the number of arrests per 10,000 students). Each color-coded column represents a racial/ethnic category, allowing users to compare how rates vary across groups and refer to the exact figures from the labels. Because these are broad federal categories, users can and should seek further disaggregation at the state or local level to better understand the distinct experiences of students in your community in order to identify the most effective policies and programs.
What It Shows
The first chart presents the rates of law enforcement referrals across racial/ethnic groups (School-based referral rates per 10,000 students in the United States, elementary school level, by race/ethnicity). Indicated by different colors, each bar reflects the referral rates of a different group. Through this bar chart, users can visualize how referral rates vary across racial/ethnic groups of elementary students and use the labels to note the specific arrest rate for each group.
The second chart adds gender, showing the elementary school referral rates across racial/ethnic groups and then breaking each of those groups into males and females (School-based referral rates per 10,000 students in the United States, elementary school level, by race/ethnicity and gender). Using this chart, users can compare referral rates by both race/ethnicity and gender simultaneously to identify not only if there are trends between racial/ethnic student group experiences, but also if, within those groups, there are further differences for male and female students. This additional layer of data disaggregation can enable advocates and policymakers to better identify potential causes and policies to support all students.
Users should note that the disaggregations available within the CRDC data are limited to the racial and gender categories used by the US Department of Education. For a fuller picture, state and local education agencies are encouraged to collect more rigorously disaggregated data to better understand student experiences and develop policies that foster safe, welcoming schools for all.
How This Data Can Inform Decision Making
Over the past decade, several states have invested in data collection and governance, allowing them to streamline data reporting from districts and direct resources toward policies that improve student outcomes. Given that nearly half of all K-12 education funding flows from state governments, it is critical for policymakers and advocates to have access to robust data to ensure accountability, transparency, and progress measurement. Building on federal reporting requirements, states enact guidelines for measuring student success, fund their implementation, and collect data to monitor progress.
Questions that you can explore further in your state and community:
By pairing the Atlas’s arrest and referral figures with other state data—such as achievement and other metrics from education and juvenile justice departments—advocates can create a fuller picture of how discipline practices affect students’ learning and experiences.
Case Study: North Carolina’s “Raise the Age” Reform
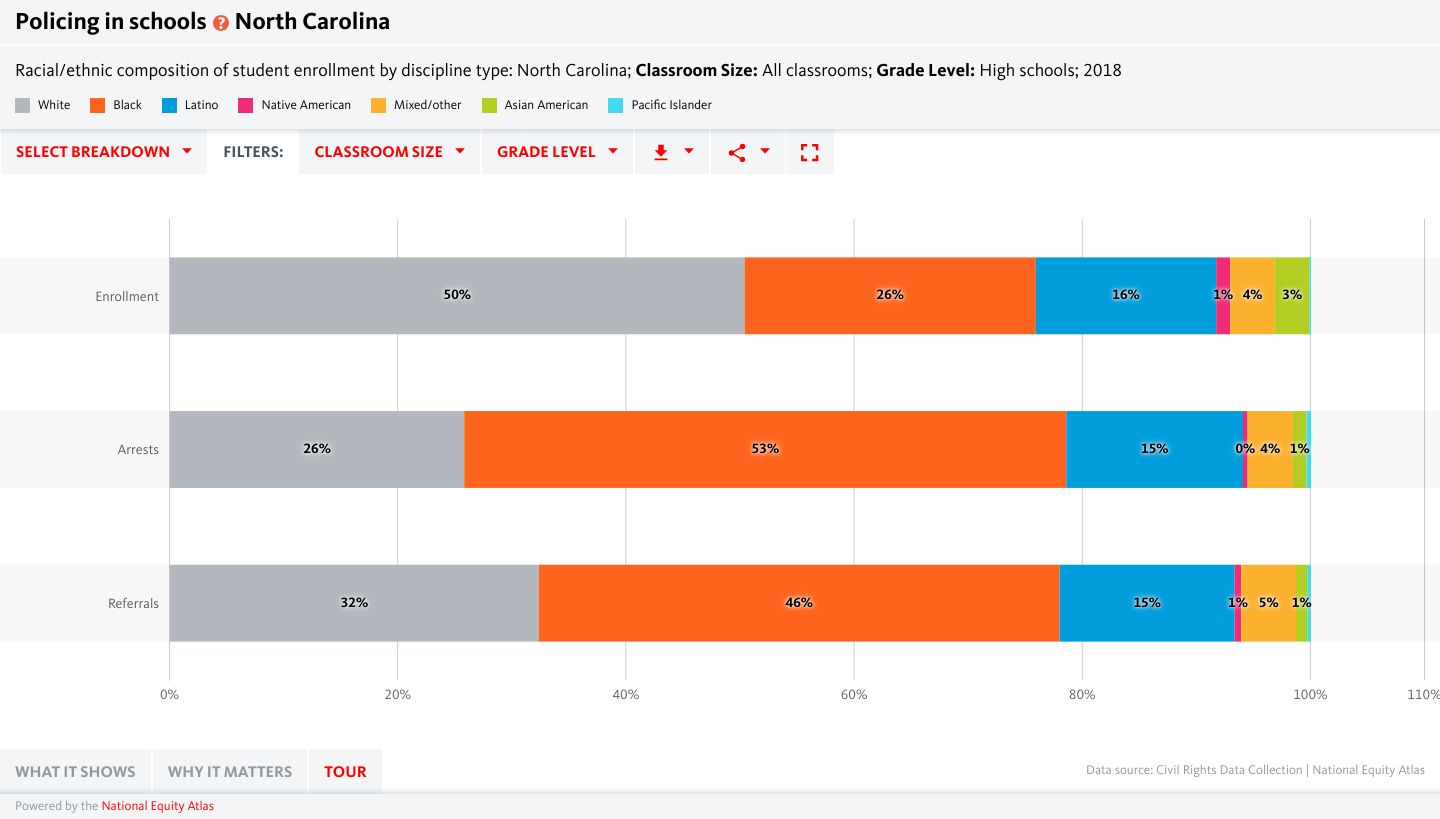
North Carolina’s Juvenile Justice Reinvestment Act (JJRA), widely known as the "Raise the Age" law, was introduced in 2017 and took effect in 2019. Before its passage, North Carolina was one of only two states (along with New York) that automatically prosecuted 16- and 17-year-olds as adults—for all crimes regardless of severity. Impacts of this practice were disproportionately felt by students of color; using the Policing in Schools Indicator, we can see that in the years leading up to Raise the Age’s passage (2017–2018), Black students accounted for roughly half of all school-based arrests and referrals, although they made up only one quarter of North Carolina high school enrollment.
The Youth Justice Project, a project by the Southern Coalition for Social Justice, used similar data sources in North Carolina to create Racial Equity Report Cards (RERCs). Drawing on CRDC data, state achievement metrics, and juvenile justice records, the report cards reported state trends overall and for each of its 115 districts. These RERCs showed that school-based referrals accounted for only 30 percent of juvenile complaints in 2018 and that 16- and 17-year-olds were automatically funneled into the adult criminal system. Such efforts underscore that the true scope of youth pushed into the criminal system is likely broader than federal CRDC data alone suggest. Therefore, complementing this data with additional sources can equip advocates with a more accurate portrait of student experiences and inequities to be addressed.
Local knowledge and lived cultural experiences enrich the insights that we can glean from large datasets like the CRDC. Community residents and advocates can provide deeper insights into the stories behind the numbers, explain potential missing variables, and prompt a deeper interrogation of questionable data.
Case Study: County-Level Arrest Rates in New York State
Consider the following example from New York State. On the surface, the county-level CRDC tables show that Oneida County had the highest school-based arrest rate in 2017–18 (28 per 10,000 students). Note for users: Not all counties listed in the display are available in the Atlas geography selection. The data for this visualization exists within the CRDC data and was pulled directly from the underlying dataset.
However, education advocates and New York had the additional context that prompted another look at the data—that the numbers across five specific counties, those in NYC, seemed comparatively low. These counties (Bronx, Kings, New York, Queens, and Richmond), together comprising the New York City Department of Education (NYC DOE), have a total enrollment of 1,032,049 students, nearly 30 times that of Oneida County’s at 34,781. However, the NYC DOE reported only 9 arrests, compared to 98 reported in Oneida.
A closer examination of the data and reporting methodology reveals that the data for the New York City Department of Education was suppressed due to data quality issues. Education advocates can and should draw upon their own knowledge of conditions in their communities to examine data and hold education officials responsible for accurately collecting and reporting data on their communities.
Key Decision-makers in School Discipline in K-12 Education
School discipline policies are influenced by federal, state, and local laws, each playing a distinct role.
- Federal level: The federal government provides broad policy guidelines and enforces basic civil rights protections for educational access, such as through IDEA, the Civil Rights Act, and the Americans with Disabilities Act (ADA); it leaves most program implementation decisions to state governments. Providing around 8–10 percent of K-12 education funding, federal-level support is directed toward programs such as Title I for low-income students, the Individuals with Disabilities Education Act (IDEA) for special education, and others for school nutrition and English Language Learner supports.
- State level: Responsible for providing the majority of K-12 education funding, states establish required school discipline policies across districts (e.g., limits or bans on corporal punishment and physical restraints) as well as audit the relevant discipline data.
- Local level: Elected school boards and district leaders translate federal and state mandates into practice by setting the specific discipline policies that schools must follow, overseeing the everyday implementation of school discipline. For example, school boards define codes of conduct, determine suspension and expulsion rules, and decide whether—and how—police operate on campus.
Knowing who controls discipline policy is critical in empowering students, families, and allies to focus their advocacy on the right decision-makers, and access to reliable public data (across all levels of government) is critical for driving accountability, exposing inequities, and guiding community-responsive policymaking that truly addresses the needs of its youth, creating positive, supportive school climates for all.
