Our rent debt dashboard, produced in partnership with the Right to the City Alliance, equips policymakers and advocates with data on the extent and nature of rent debt in their communities to inform policies to eliminate debt and prevent the specter of mass eviction.
By Sarah Treuhaft, Jamila Henderson, Michelle Huang, Alex Ramiller, and Justin Scoggins
Mounting rent debt and the potential for mass eviction is one of the most pressing equity issues created by the Covid-19 pandemic. The vast majority of renters who are in debt are low-wage workers — disproportionately people of color — who’ve suffered job and income losses due to the pandemic. Without sufficient eviction protection, debt relief, and financial support, these Covid-impacted renters will be left behind — deepening inequities at a moment when the federal government has prioritized addressing systemic racism and ensuring an equitable recovery.
To inform the national policy debate, as well as local and state policymaking and advocacy, in April 2021, the National Equity Atlas and the Right to the City Alliance launched a rent debt dashboard with near real-time data on the number and characteristics of renters behind on rent for the US, 41 states, and 15 metro areas.* The dashboard provides estimates of the amount of back rent owed for these geographies, as well as estimates for the number of households with debt and the amount owed for all counties in the 41 states. Drawing current data from the Census Bureau’s Household Pulse Survey and the University of Southern California Center for Economic and Social Research's Understanding Coronavirus in America survey, the dashboard data is refreshed approximately every two weeks. Find our full methodology here.
Born out of the need for accessible, current data to inform local and state campaigns, the dashboard was produced in partnership with the Right to the City Alliance, a network of community-based organizations working in 45 cities and 26 states to prevent displacement, expand affordable housing, and build just, sustainable cities for all.
This analysis shares key insights from the dashboard, based on the April 14-26 Pulse survey, as well as action steps that local, state, and federal policymakers can take to stabilize the people most negatively impacted by the pandemic and facilitate equitable recovery by addressing the challenge of rent debt head-on.
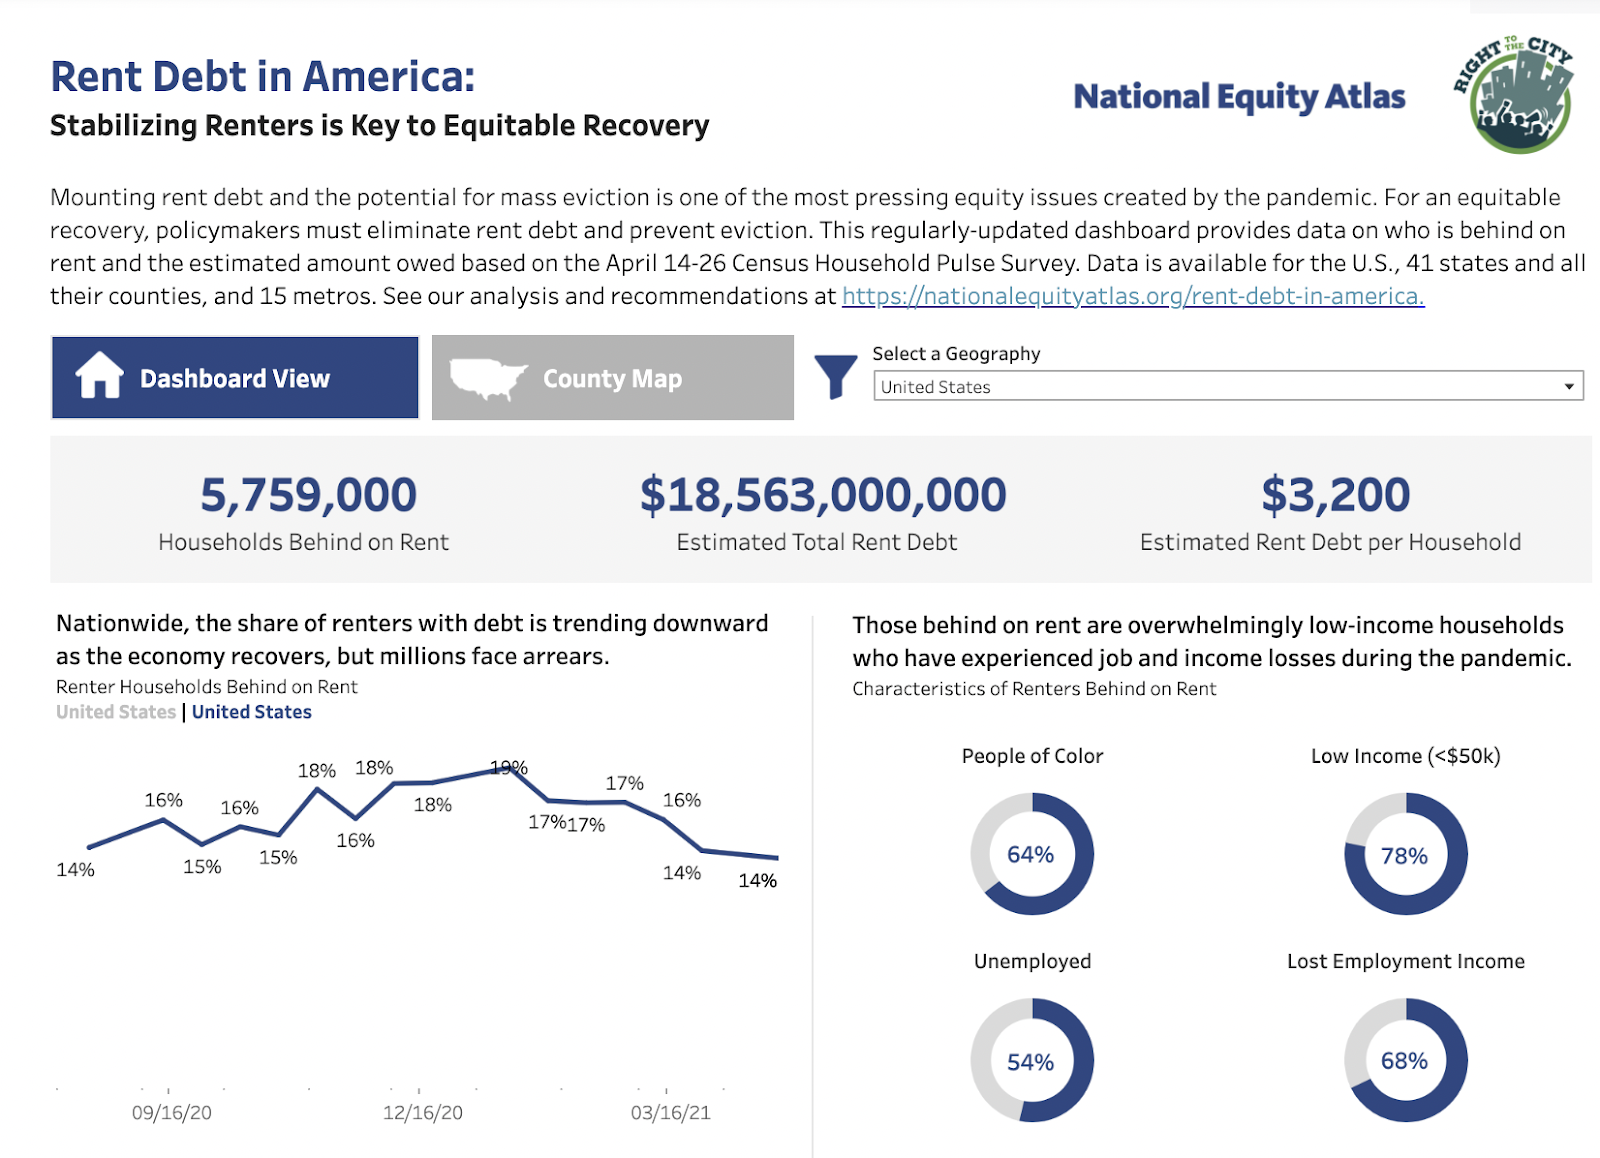
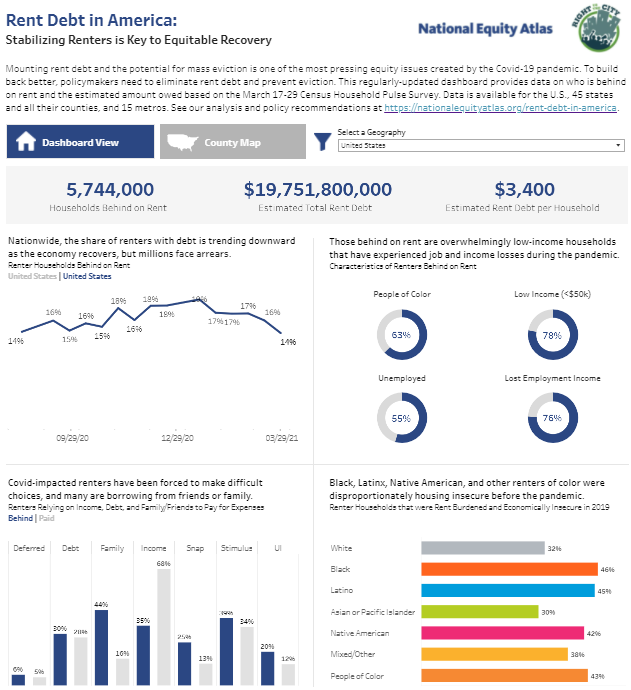
Rent debt continues to be a significant issue, with 5.8 million renter households behind on rent.
As of the end of April 2021, 5.8 million renters – 14 percent of all renter households – were behind on their rent payments. Renters with arrears will be at imminent risk of eviction in the absence of strong eviction moratoria and other renter protections, and the current federal eviction moratorium from the Centers for Disease Control and Prevention is scheduled to expire June 30. As a point of comparison, nearly 8 million households lost their homes to foreclosure due to the 2008 financial crisis.
The Pulse survey has been asking the question “Is this household currently caught up on rent payments?” every two weeks since August 2020. Nationally, the current share of renters with debt is down from a high of 19 percent in mid-January, but remains far higher than the pre-pandemic baseline. While data on rent debt is sparse, the 2017 American Housing Survey found that about seven percent of renters were unable to pay some or all of their rent.
The share of renters who are behind on rent is much higher than the national average in some states and metro areas. Alabama has the highest share of renters with arrears (29 percent), and at least 20 percent of renters are behind in the states of Arkansas, South Carolina, Maryland, and New Jersey. Rhode Island has the lowest share of renters with debt (2 percent) followed by Utah (5 percent).
Among the 15 metros included in the Pulse survey, Atlanta has the highest share of renters with debt (24 percent), followed by Miami (20 percent), New York City and San Francisco (19 percent), and Washington DC (18 percent). Phoenix has the lowest share of renters in arrears among the 15 metros (7 percent).
Nationally, we estimate that rent debt amounts to about $19 billion.
According to our estimates, households that are behind on rent owe $3,200 on average, for a total of $18.6 billion nationwide. As this average suggests, the majority of households who are behind owe one or two months of back rent. However, a smaller but not insignificant number of renters have not been able to pay rent for many months and owe much larger amounts. Our analysis of the University of Southern California’s Understanding Coronavirus in America national survey finds that 27 percent are one month behind, 27 percent are two months behind, 10 percent are three months behind, and the remaining 36 percent are more than three months behind.
The average amount owed depends primarily on local housing costs, so it varies significantly across states and metros. Among states, Hawaii has the highest average rent debt per behind household ($5,200), while Arkansas has the lowest ($2,000). At the metro level, San Francisco and Washington DC have the highest average debts ($5,300 and $4,800, respectively), while Detroit has the lowest average debt by far ($2,400), followed by Atlanta ($2,900).
Our national estimates of rent debt fall somewhere in the middle of existing projections in terms of total debt, and on the lower end in terms of per household amount. In January, Moody’s Analytics projected that 6.3 million renters would owe a total of $33 billion in rent debt by March, at an average of $5,282 per household. Stout Analytics estimated that between two and five million renter households owed between $13 and $24 billion as of January. Both Moody’s and Stout used the Pulse survey to inform their estimates of the number of households behind. Using a very different methodology based on modeling employment losses, income supports, and spending choices at the household level, and not incorporating the Pulse survey data, the Federal Reserve Bank of Philadelphia estimated that 1.8 million renter households would owe $11 billion in rent in March, at approximately $6,100 per household.
With the incipient recovery, the number of renters with debt is declining nationwide, but some states and metros saw increases from March to April.
Nationwide, the share of renters with debt is trending downward from a high of 19 percent in January 2021 to 14 percent at the end of April. Nearly all states and metros are following this general downward trend since their peaks. However, when we look at the most rencent month of data, we see that some communities are seeing declines while others are seeing increases. Between the end of March and the end of April, rates of renters behind rose in 20 states and seven metros.
Among states, Tennessee saw the biggest spike in arrearages (from nine to 20 percent behind), followed by Arkansas (from 14 to 23 percent), and Hawaii (from eight to 16 percent). West Virginia and Mississippi saw the biggest improvements (from 31 to 13 percent behind).
Among metros, Atlanta saw the largest increases (from 11 to 24 percent behind). Riverside saw the greatest decrease (from 22 to eight percent).
The vast majority of those who are behind on rent are low-income households who’ve lost jobs and income during the pandemic.
Today’s rent debt crisis is entirely a consequence of the pandemic’s economic fallout: 68 percent of those who are behind on rent lost employment income at some point during the pandemic. As our other research has shown, low-wage workers, who are disproportionately workers of color, were hardest hit by pandemic job losses and are most likely to suffer from rent debt. Among households with rent debt, 78 percent are low-income (with earnings less than $50,000 per year) and 64 percent are renters of color. The majority (54 percent) are currently unemployed.
Renters have made tremendous sacrifices and tradeoffs to stay current on rent, including foregoing medical care, delaying payment of other bills, eating cheaper (and potentially less healthy) food, and voluntarily moving in with friends and family — increasing risk of Covid-19 exposure while losing their housing stability. One of the most surprising facts in the data is the high share of low-income renters who are paid in full: Among low-income households that lost employment income during the pandemic, 73 percent are not behind on rent. This underscores how paying rent has remained a top priority for all renters throughout the pandemic, despite the moratoria on evictions.
Rent is not the only debt accumulating for renters.
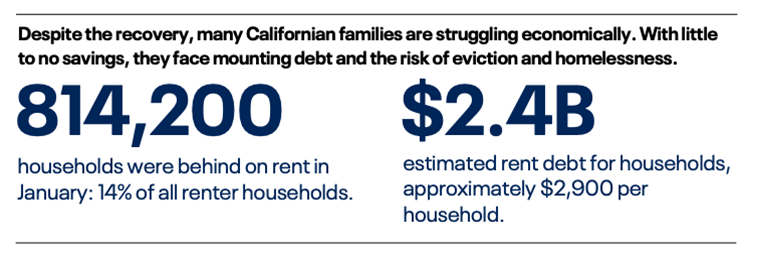
While our analysis focuses on back rent, renters’ pandemic debt crisis extends far beyond their obligations to their landlords. Many renters are borrowing from family and friends or taking on other forms of debt in order to make rent and pay for household expenses. Among households behind on rent, 41 percent borrowed from friends or family to pay rent, compared with just 15 percent of households current on rent. About 30 percent of all renter households, whether behind or current on rent, used a credit card (or some other form of debt) to pay rent. Many are behind on other bills, such as utilities or car payments. A survey of water debt in California found that 1.6 million households owed $1 billion on water bills — $500 on average.
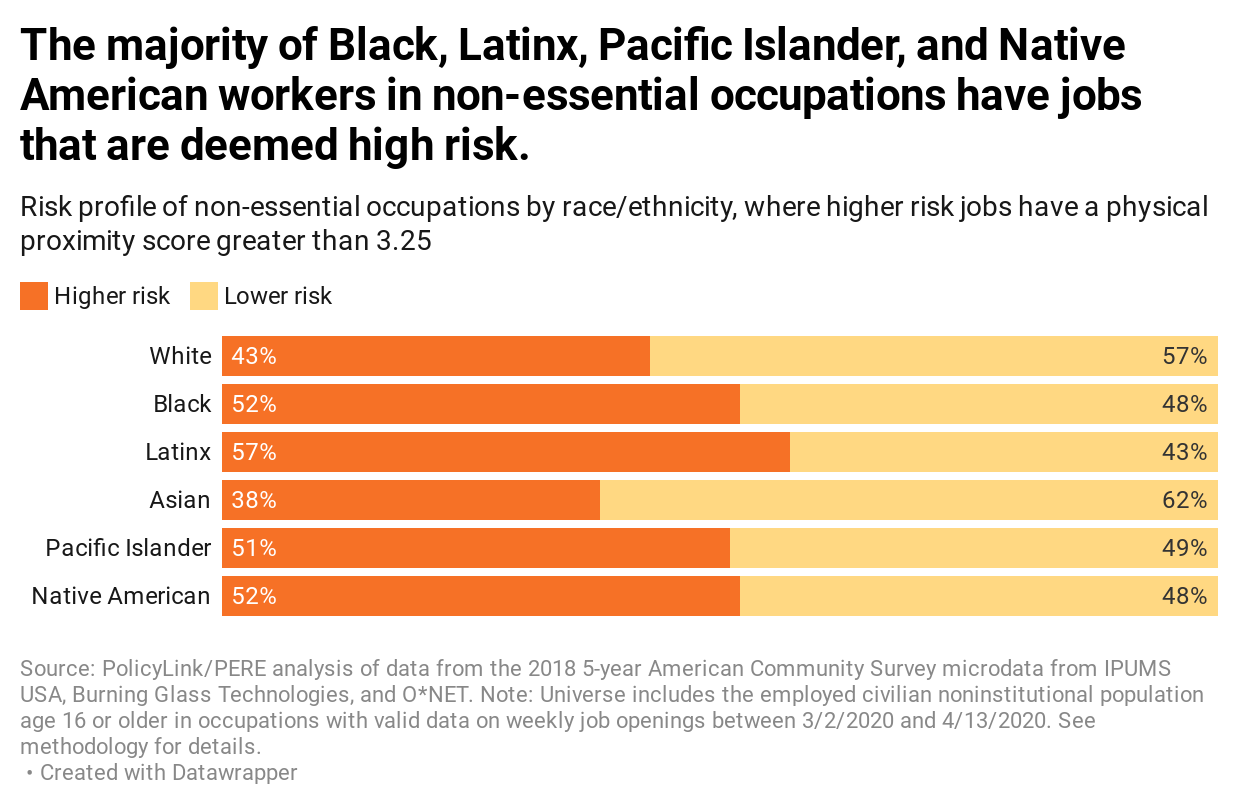
Renters of color have been disproportionately impacted by the pandemic and are more likely to owe back rent, making them more vulnerable to eviction risk.
In the United States, renters are already a more vulnerable population as a whole: they have little housing security, paltry savings, and few legal protections from exorbitant rent increases or eviction (outside of a few states and cities with strong tenant movements). Historic and continuing housing and lending discrimination, as well as systemic inequities in our labor market, have contributed to large racial inequities in homeownership. Atlas data shows that seven in 10 White households own their homes while the majority of Black, Latinx, and multiracial households rent.
The challenge of unaffordable rents and flat wages add to this underlying housing insecurity among renters. Renters were already in crisis when the pandemic began: about a third of White renters and just under half of Black and Latinx renters were both economically insecure (earning less than 200 percent of the federal poverty level) and rent burdened (paying more than 30 percent of their income on rent). Gender is another important axis: women of color are most likely to be rent burdened, and disproportionately face eviction.
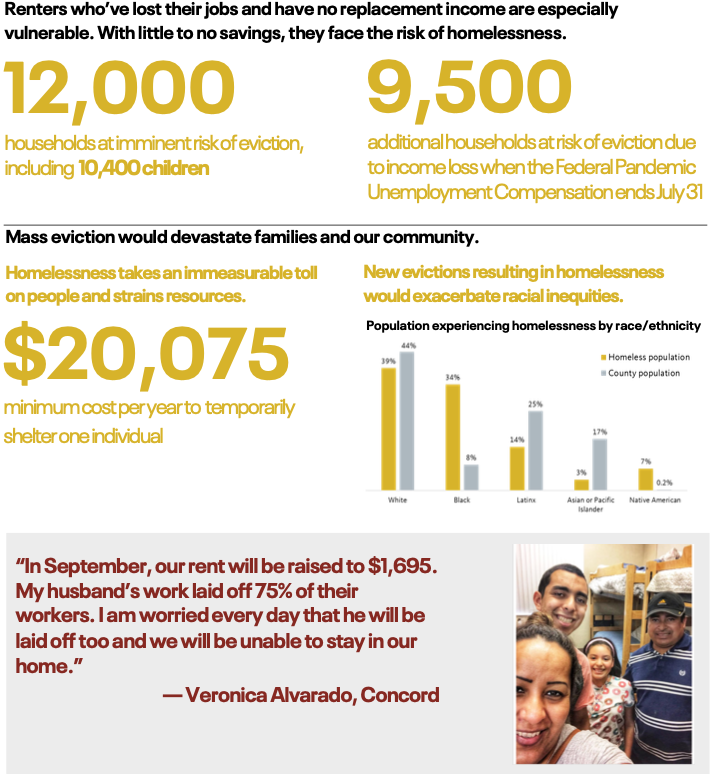
Covid-19 added yet another layer of inequity to these preexisting disparities. Today, 10 percent of White renters are behind on rent, compared to 20 percent of Asian or Pacific Islander renters, 20 percent of Latinx renters, and 22 percent of Black renters.
Eliminating Rent Debt is an Equity Imperative and a Moral, Economic, and Public Health Necessity
Today’s rent debt crisis is a microcosm of the wretched inequality of the pandemic: millions of renter households – most of them people of color – now face the burden of owing back rent due to a public health crisis that had extremely concentrated negative economic impacts on low-wage workers. These unequal consequences are not random, but the predictable result of past policies that left millions of families with no savings to draw upon in the face of an economic shock, as well as the failed early policy response to the pandemic. Although the CARES Act provided important unemployment benefits and cash assistance as well as an eviction moratorium that helped many pandemic-impacted renters, undocumented and mixed-status families were ineligible for assistance and the moratorium ended in July, leaving renters unprotected until the CDC enacted its moratorium in early September. Moreover, absent meaningful financial assistance to pay back rent, the moratoria simply delay eviction. Yet, the federal government provided no rent relief until December, nine months into the pandemic.
The magnitude of rent debt is a crisis in and of itself and the leading indicator of a potential eviction tsunami that would be a humanitarian disaster. Rent debt adds a heavy burden onto families who are already financially insecure and struggling during the pandemic, further limiting their choices and creating additional stress. It’s also contributing to the growth of the racial wealth gap: while renters, predominantly people of color, currently hold $20 billion in debt, homeowners, who are predominantly White, saw a $1.5 trillion increase in their home equity between October 2019 and October 2020 as competition for a constrained supply of homes drove prices up. At a time when racial equity is at the forefront of the policy debate, eliminating rent debt that has unfairly and unequally accrued for people of color should be an urgent priority.
Clearing rent debt is also key to staving off the specter of mass eviction, which would directly harm economically vulnerable families and their communities and have long-term ripple effects throughout our economy. Eviction has significant negative consequences for mental and physical health, educational outcomes, and household finances. Some evicted families and individuals would become homeless, with devastating consequences for long-term health and well-being as well as significant costs for local governments.
The health impacts of eviction and homelessness are even more severe during a pandemic. Research during the pandemic found that states that allowed evictions to proceed had more Covid infections and deaths than those with eviction moratoria. Although the vaccination campaign is in full swing and Covid cases are low in most states, there are hotspots with high infection rates and the longer-term picture remains uncertain.
Forgiving rent debt is also essential to an equitable and people-centered recovery: one in which those hardest-hit by the pandemic can fully participate and thrive.
For an Equitable and Just Recovery, Policymakers Must Clear Rent Debt and Prevent Eviction
Recognizing the catastrophic impact of mass eviction, policymakers have responded, albeit belatedly, by enacting eviction moratoria and establishing rent relief funds. The federal CDC eviction moratorium scheduled to expire last month was extended through June 30th, and the American Rescue Plan passed in January provided $25.1 billion for rental assistance programs as well as $350 billion in fiscal support for state and local governments, some of which could be allocated toward debt relief. The December 27 coronavirus relief bill also provided $25 billion in funding for rental assistance.
These are important steps, and more must be done to ensure that all struggling renters emerge from this crisis safely in their homes with no debt. The eviction moratorium is far from airtight: many evictions are still proceeding, and renters need stronger protections. In addition, rent relief programs are not reaching all of those with need; these programs must be structured to meet the scale of the crisis, both to efficiently deliver resources and to ensure that resources are distributed equitably, reaching the low-income renters of color hardest hit by the pandemic who were already housing insecure before Covid-19.
As they design rent relief programs, local and state policymakers should implement policies that adhere to the following equitable, common sense principles:
- No renter, regardless of immigration status, should be evicted or burdened with years of debt for rent that they were unable to pay during the pandemic.
-
Rent debt due to the pandemic should be fully forgiven and should not be conditioned on landlords’ acceptance of funds or participation in programs.
-
Financial assistance to landlords should address the fiscal needs of landlords in danger of going out of business due to lost rent, with a particular focus on keeping small community-based landlords and nonprofit affordable housing operators solvent, rather than attempting to achieve full rent replacement for all landlords. California’s program, negotiated with the state’s landlord association, provides an example: landlords receive 80 percent of back rent owed.
-
Local municipalities’ authority to pass stronger eviction and debt protection laws should be preserved.
-
Landlords should continue to fulfill their legal obligations to tenants regardless of whether they receive assistance, including the duty to maintain habitable premises, refrain from harassment and retaliation against tenants, and respecting tenants’ legal rights.
For more local policy ideas and examples, see https://ourhomesourhealth.org
* The number of renter respondents to the Pulse survey for Iowa, Kentucky, Maine, Mississippi, North Dakota, South Carolina South Dakota, West Virginia, and Wyoming was insufficient to produce reliable data to include in the dashboard.