
Air Pollution Data and Analysis
Relevant indicators:
- Air pollution
The air pollution data presented in the Atlas are derived from exposure to air toxics data from the National Air Toxics Assessment (NATA) and the Air Toxics Screening Assessment (AirToxScreen), developed by the US Environmental Protection Agency. The NATA and AirToxScreen use general information about emissions sources along with modelling of ambient concentrations of different air toxics and population exposure to characterize potential health risks from inhalation. The results are subject to a variety of limitations and are meant to be used as a screening tool to help local agencies identify pollutants, emissions sources, and geographic areas that should be further investigated to better understand risks to public health from air pollution. The results for various years are not directly comparable due to differences in data and methodology. Note, however, that because the Atlas indicators we developed using this data are relative – based on a relative comparison of census tracts across the US) – the fact that the underlying risk estimates themselves are not directly comparable is less problematic.
The NATA/AirToxScreen data include estimates of cancer risk and respiratory hazards (non-cancer risk) at the census tract level based on exposure to outdoor sources. It is important to note that while diesel particulate matter (PM) exposure is included in the NATA/AirToxScreen non-cancer risk estimates, it is not included in the cancer risk estimates (even though PM is a known carcinogen). Emissions source types were grouped into four categories for use in the Atlas: on-road mobile (e.g., cars, trucks, buses), off-road mobile (e.g., airplanes, trains, lawn mowers, construction vehicles, farm machinery, boats), major stationary (e.g., larger commercial/industrial facilities such as power plants, refineries, and factories), and area and other. The last of these categories is a residual category and includes smaller commercial/industrial facilities (e.g., dry cleaners and small manufacturers) along with fires and other natural sources and secondary and background sources. See here for more information about the NATA data and here for more information about AirToxScreen, which succeeded NATA in 2017.
The index of exposure to air pollution presented in the Atlas is based on calculations of three exposure indices at the census tract level, using the NATA/AirToxScreen: cancer risk, respiratory (or non-cancer) risk, and the two risk types combined. While the NATA/AirToxScreen generally includes estimates for Puerto Rico and the US Virgin Islands, our analysis for this indicator (and all indicators in the Atlas) excludes all US territories. For the cancer and non-cancer risk indices, the two NATA/AirToxScreen risk measures were simply ranked at the census tract level across the entire United States, from 1 to 100 (in ascending order, so that “100” includes the top one percent of all US tracts in terms of risk). For the combined risk index, we followed the approach used by the US Department of Housing and Urban Development (HUD) in developing its Environmental Health Hazard Index. The HUD Environmental Health Hazard Index includes neurological risk in addition to cancer and respiratory risk. However, given that neurological risk was is not included in the nationwide results for all years of the NATA/AirToxScreen we use for the Atlas air pollution indicator, it is excluded from our analysis. The cancer and non-cancer estimates were combined by calculating tract-level z-scores for each and adding them together as indicated in the formula below:
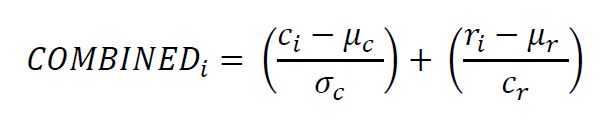
Where c indicates cancer risk, r indicates respiratory risk, i indexes census tracts, and μ and σ represent the means and standard deviations, respectively, of the risk estimates across all census tracts in the United States. As with the individual risk indices, the combined tract level index, COMBINEDi was ranked in ascending order across the entire United States, from 1 to 100.
With the three tract-level rankings in place (for cancer, non-cancer, and combined risk), we then estimated the contribution to each ranked value of four source categories. As noted above, these include on-road mobile, off-road mobile, major stationary, and area and other. To estimate their relative contributions to each ranked risk index, we multiplied each tract-level ranking by the tract-level ratio of the risk estimate for each source category to the total risk estimate for the tract (such that the sum of contributions across source categories was equal to the ranked risk value in each tract). For the combined cancer and non-cancer ranking, the tract-level ratio for each source category was calculated by taking a weighted average of the ratios for the two risk types, using their aforementioned z-scores as weight.
Finally, the tract-level rankings (and their contributions by source category) were summarized for each Atlas geography and demographic group (i.e., by race/ethnicity and poverty status) by taking a population-weighted average using the group population as weight, with group population data drawn from the relevant ACS summary file (see indicator-specific data notes for the particular NATA/AirToxScreen and Census/ACS summary files used for each year of the air pollution indicator reported on the Atlas). The result of that population-weighted average is the index of exposure to air pollution presented in the Atlas. The index value reported reflects the national percentile ranking in terms of pollution burden for each group and geography for which it is reported. For example, an exposure index value of 25 for all people suggests that the average person, in the indicated Atlas geography and for the indicated risk type, lives in a neighborhood (census tract) that ranks at the 25th percentile nationally (that is, it has greater pollution exposure than 24 percent of all census tracts in the US but less exposure than 75 percent of all tracts). An exposure index value of 56 for the Black population suggests that the average Black person in the indicated Atlas geography and for the indicated risk type lives in a neighborhood that ranks at the 56th percentile nationally in terms of pollution exposure.