Estimates of Income and GDP Gains with Racial Equity
Relevant indicators:
- Economic gains: Racial equity in income
Estimates of the gains in average annual income and GDP under a hypothetical scenario in which there is no income inequality by race/ethnicity are based on the IPUMS ACS microdata and GDP data from BEA. To develop our estimates, we applied a methodology similar to that used by Robert Lynch and Patrick Oakford in Chapter Two of All-in Nation with some modifications to expand the analysis and to apply the analysis to multiple geographic areas. The expansions made were done to include gains from increased employment rates and to enable the decomposition of total income gains into the portions attributable to increased work efforts (figured as average annual hours of work) versus increased wages (figured as average annual income per hour of work). As in the Lynch and Oakford analysis, once the percentage increase in overall average annual income was estimated, GDP was assumed to rise by the same percentage. A more detailed description of the methodology is provided below.
We first organized individuals aged 16 or older in the IPUMS ACS into the seven mutually exclusive racial/ethnic groups used in the Atlas: non-Hispanic White, non-Hispanic Black, Latino, non-Hispanic Asian American, non-Hispanic Pacific Islander, non-Hispanic Native American, and non-Hispanic Other or multiracial. Following the approach of Lynch and Oakford in All-In Nation, we excluded from the non-Hispanic Asian American category subgroups whose average incomes were higher than the average for non-Hispanic Whites, with the particular subgroups to be excluded determined separately for each of the geographic areas for which we report data for this indicator. Also, to avoid excluding subgroups based on unreliable average income estimates due to small sample sizes, we added the restriction that a subgroup had to have at least 100 individual survey respondents in order to be excluded.
We then assumed that all racial/ethnic groups had the same average annual income and hours of work, by income percentile and age group, as non-Hispanic Whites, and took those values as the new “projected” income and hours of work for each individual. For example, a 54-year-old non-Hispanic Black person falling between the 85th and 86th percentiles of the non-Hispanic Black income distribution was assigned the average annual income and hours of work values found for non-Hispanic White persons in the corresponding age bracket (51 to 55 years old) and “slice” of the non-Hispanic White income distribution (between the 85th and 86th percentiles), regardless of whether that individual was working or not. The projected individual annual incomes and work hours were then averaged for each racial/ethnic group (other than non-Hispanic Whites) to get projected average incomes and work hours for each group as a whole, and for all groups combined. The income gains for each group (and for all groups combined) were then decomposed into the portions attributable to increased hours of work and income per hour using the following formula:
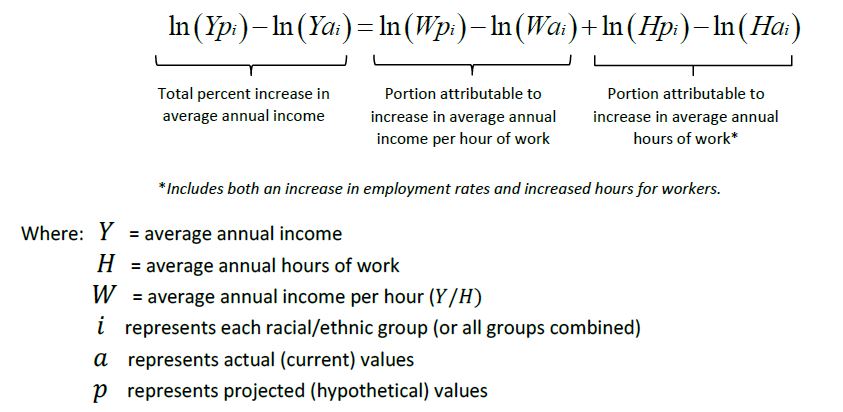
Once decomposed, the portions of the income gain attributable to increased wages (increased average annual income per hour of work) and increased employment (average annual hours of work) were restricted to range between zero and 100 percent.
One difference between our approach and that of Lynch and Oakford is that we include all individuals ages 16 years and older, rather than just those with positive income. Those with income values of zero are largely non-working, and were included so that income gains attributable to increased hours of work would reflect both more hours for the those currently working and an increased share of workers – an important factor to consider given differences in employment rates by race/ethnicity. One result of this choice is that the average annual income values we estimate are analogous to measures of per capita income for the age 16- and-older population and are thus notably lower than those reported in Lynch and Oakford. Another is that our estimated income gains are relatively larger as they presume increased employment rates.
Note that because no GDP data is available at the city level (partly because economies tend to operate at well beyond city boundaries), our estimates of gains in GDP with racial equity are only reported for metro areas, states, and the U.S. as a whole. Estimated income gains and the source of gains by race/ethnicity, however, are reported for all Atlas geographies, including cities.