Racial Equity Index Methodology
The Racial Equity Index was designed to describe how equitable a region is when considering multiple indicators together and assess whether communities are seeing progress on racial equity and overall prosperity. It is the first index of its kind that combines all the following desired attributes:
- National in scope, with data for a wide variety of geographies (cities, counties, states, and metro areas)
- Presents separate indices of inclusion and prosperity
- Avoids relying only on typical measures of economic growth (e.g., GDP and job growth) in specifying a prosperity score (as these do not reflect the lived experiences of people of color and low-income communities)
- Places an intentional focus on race/ethnicity in specifying inclusion scores
- Uses the same underlying indicators/metrics for measuring inclusion and prosperity
- Includes data points so progress can be tracked over time
- Undergoes regular updates and is delivered via a website
See "Review of Other Indices" below for a list of other indices measuring aspects of racial equity and how they compare to the Racial Equity Index.
Design Summary
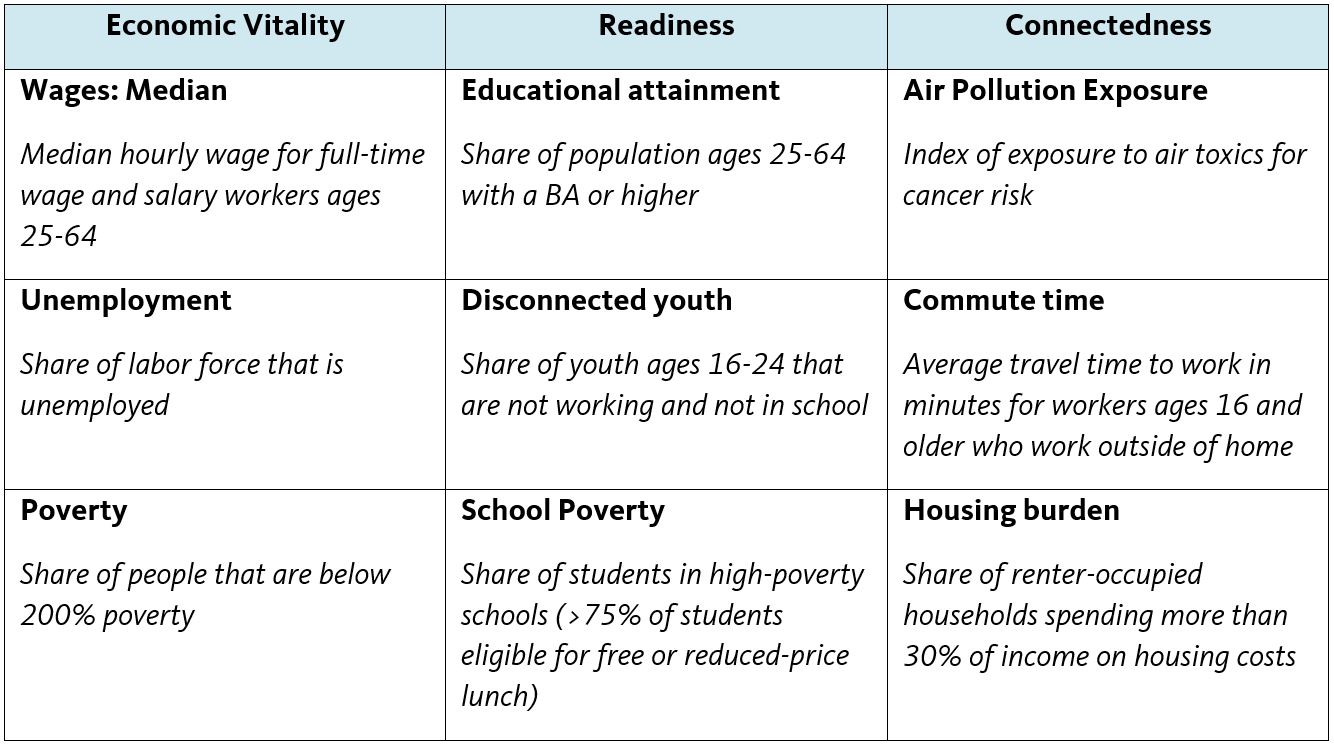
The Racial Equity Index is based on a set of nine indicators, with three indicators from each of three categories found on the National Equity Atlas: Economic Vitality, Readiness, and Connectedness. Indicator values are drawn for both the total population covered by the indicator (the “universe”) and the population by race/ethnicity for six broad, mutually exclusive racial/ethnic categories for which Atlas data is generally available (white, Black, Latinx, Asian American or Pacific Islander, Native American, and Mixed/other). Note that while many Atlas indicators disaggregate data for Asian Americans and Pacific Islanders separately, the two groups are combined into one in the derivation of the Racial Equity Index to ensure comparability over time going back to the year 2000, when disaggregated data was not available for all nine indicators that feed into the index.
While the nine indicators may be subject to change, we include the current set of indicators in the table below. We chose them to capture a range of different aspects of the equity profile of a region, to allow for examination of change over time, and to strike a balance between the number of indicators in each category.
Values of each indicator for the total population reflect the (population-weighted) average across all racial/ethnic groups in each geography. We use these overall population values to measure the level of “prosperity.” To measure the level of “inclusion” according to each indicator, or how evenly distributed prosperity is across racial/ethnic groups, we construct an index of disparity that draws upon indicator values by race/ethnicity. We construct the Index of Disparity (ID) following the approach described in Pearcy and Keppel (2002), using the formula below.
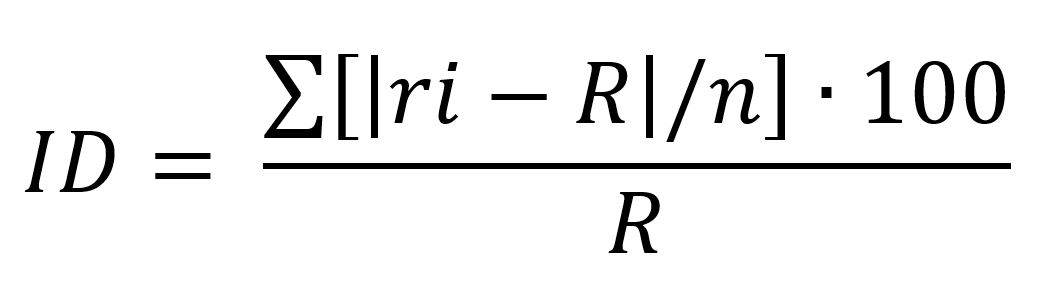
Where r is the indicator value for each racial/ethnic group i, R is the value for the total population, and n is the number of racial/ethnic groups with valid data. We calculate the ID only for indicators and geographies where data are available for two or more racial/ethnic groups. In short, the ID averages the absolute value of the differences between each group and the overall population, and expresses it as a percentage of the overall population value.
We also tested a “weighted” ID, derived to ascribe more weight or influence over the final index value to the disparities experienced by the more populous groups. While this made intuitive sense—that is, if two regions have similarly sized gaps, but one has larger populations experiencing those gaps, then it should get a higher ID (or lower “score” on equity)—in practice we found that it resulted in a systematic bias such that regions with larger White populations tended to have lower ID values. The reason for this, we think, is because the White population tends to be the most advantaged group for each indicator, and the larger their share of the population, the closer they are likely to be to the overall average (since they drive the average up toward their indicator value). This in turn leads to a smaller "gap" between their value and the overall average value, and that gap also gets a lot of weight in deriving the weighted ID. The result is a systematic downward bias on the weighted ID for regions with larger White population shares.
With overall population values to capture “prosperity” and ID values to capture “inclusion” for each indicator in place, we normalize the values by converting them into z-scores, which we compute relative to all other geographies of the same type (i.e., the largest 100 cities, 430 large counties, the largest 150 metro areas, and all 50 states). We then reverse the sign of the z-scores for prosperity indicators for which higher values are the opposite of prosperous (such as unemployment), and also reverse the signs of all z-scores for the ID values (so that higher values are indicative of equity rather that disparity). Next, we again normalize the resulting z-scores using min-max scaling, which expresses each z-score as a percentage of the range between the minimum and maximum score. The result is a prosperity score and an inclusion score that each range between zero and 100, but we reset scores below one (generally, the regions with the minimum value for each indicator) to one so that the final scores range from one to 100. We then take the geometric mean of the resulting scores across the indicators in each category (Economic Vitality, Readiness, and Connectedness) to get final inclusion and prosperity scores for each category and take the geometric mean of the category scores to get overall inclusion and prosperity scores for each region. The last step is to take the geometric mean of the two regional scores to get a single score that characterizes the level of inclusion and prosperity combined (the Racial Equity Index).
To measure change over time in inclusion and prosperity, we simply derive separate scores for different years and examine them over time. This means that we only include indicators for which we have multiple data points over time.
Prosperity Scores by Race/Ethnicity
The Racial Equity Index describes overall inclusion and prosperity in a region, with the measure of inclusion reflecting gaps in prosperity by race/ethnicity summarized into a single index score. Thus, while a user could examine the underlying indicator data by race/ethnicity, which is available on the Atlas, to understand which groups are doing well and which are not on an indicator-by-indicator basis, they could not easily see which groups are driving an apparently low overall prosperity score (or low prosperity score for any of the three indicator categories). To solve this problem, we derive prosperity scores by race/ethnicity. In doing so, we sought to ensure consistency and comparability of the prosperity score values for each racial/ethnic group with the prosperity score values for regions overall, as described above, as well as when comparing prosperity scores by race across racial/ethnic groups within or between regions.
While several approaches were tested, we found that applying regression analysis resulted in the most consistent and comparable prosperity scores by race/ethnicity. We took advantage of the fact that, for a given indicator, year, and type of geography (e.g., states, cities, metro areas), there is a perfectly linear relationship between the actual indicator values for the overall population and the prosperity score for the indicator. The linear relationship is a byproduct of the min-max scaling that was applied in generating the prosperity score values. We ran a separate linear regression for each indicator, type of geography, and year, with the prosperity score as the dependent variable and the underlying indicator as the sole independent variable. The y-intercept and slope coefficients were collected and applied to each corresponding indicator by race/ethnicity to derive “predicted” prosperity values by race/ethnicity. To be consistent with all other scores that are part of the Racial Equity Index, we then constrained those values to range between one and 100, resulting in the final prosperity score values for each indicator and racial/ethnic group.
To derive summary prosperity scores by race/ethnicity for each of the three indicator categories (Economic Vitality, Readiness, and Connectedness), we take the geometric mean of the prosperity score values for each racial/ethnic group across the indicators in each category and then take the geometric mean of the three category scores to derive an overall prosperity score for each group. The summary values for each indicator category and overall (across the three categories) is useful for illustrating how each racial/ethnic group in a region is doing relative to the overall prosperity score when considering multiple indicators.
A couple aspects of the prosperity score by race/ethnicity are worth reiterating. First, as noted above, we are able to derive it for all people of color combined (in addition to each specific racial/ethnic group). This is useful in regions where there is missing data for many racial/ethnic groups of color. It ensures that we can, at least, report a value for all people of color combined into a single category, which is less likely to be missing due to its larger population base. Second, because it is tethered to the overall prosperity score in a region, it is useful for making comparisons across racial/ethnic groups within a region as well as between regions.
Technical Considerations
Population weighting the index of disparity
Before deciding to use the index of disparity (ID) as described in Pearcy and Keppel (2002), we tested a “weighted” ID, that was derived to ascribe more weight, or influence over the final index value to the disparities experienced by more populous groups. While this made intuitive sense—that is, if two regions have similarly sized gaps, but one has larger populations experiencing those gaps, then it should get a higher ID (or lower “score” on equity)—in practice we found that it resulted in a systematic bias such that regions with larger White populations tended to have lower weighted ID values. The reason for this, we think, is because the White population tends to be the most advantaged group for each indicator, and the larger their share of the population, the closer they are likely to be to the overall average (since they drive the average up toward their indicator value). This in turn leads to a smaller "gap" between their value and the overall average value, and that gap also gets a lot of weight in deriving the weighted ID. The result is a systematic downward bias on the weighted ID for regions with larger White population shares.
Using the population mean as the benchmark in deriving the index of disparity
We also tested different benchmarks than the population mean for each indicator in deriving the index of disparity. Recall that the ID we calculate at the indicator level essentially averages the absolute values of gaps from the population mean across racial/ethnic groups and expresses it as a percentage of the overall population value for the indicator. Another approach, used in the Race Counts methodology, uses the “best rate” of any racial/ethnic group in each geography as the benchmark to use when calculating racial gaps. While there are merits to using the best rate as the benchmark (e.g., it sets higher aspirations for the region) we found that when implementing it over time it resulted in more volatile changes in ID values and ranking from one year to the next than when using the rate for the overall population as the benchmark. Despite testing different restrictions in terms of the minimum population size required for a racial/ethnic group’s rate to be considered the “best rate,” the changes over time ID values were still more volatile. Also, as Pearcy and Keppel (2002) note, using the rate for the overall population draws a clear connection to a specific group (i.e., the overall population) rather than a group (in this case a racial/ethnic group) that can be different depending on the indicator. In the case of the Racial Equity Index, it also draws a clear connection between the ID and the prosperity score, given that the rate for the overall population is the basis of the prosperity score.
Use of z-scores
Using z-scores to normalize indicators is the most common approach in the field. A z-score tells how many standard deviations an observation is above (or below) the mean value across all values. Z-scores of less than zero indicate values that are below the mean, while scores above zero are values above the mean. Z-scores are useful for standardizing variables—that is, putting them on a consistent scale for comparison when they are measured using different scales or units. As noted above, we derive z-scores for each geography relative to all other geographies of the same type (e.g., we compare cities with other cities, counties with other counties, metro areas with other metro areas, and states with other states). We do this because we expect a different variance in indicator values for different geographic types and it ensures greater independence among observations compared. For example, indicator values for the Los Angeles metro, which includes Los Angeles and Orange counties, are largely dependent on the values for the two largest cities in the metro (Los Angeles and Long Beach), so the values should not be treated as independent.
Use of the geometric mean
The geometric mean is derived by taking the product of a series of N values and then taking the Nth root of the result. It differs from the arithmetic mean (i.e., simple mean, average) which is derived by taking the sum of a series of N values and then dividing the result by the number of values (N). The two means are the same when there is no variation in values. For example, given the values 90 and 90, both the geometric and arithmetic mean is 15. However, given the values 90 and 10, the arithmetic mean is 50 ([90∙10]/2) but the geometric mean is 30(√[90x10]). A good rationale for using the geometric mean when combining indicators to derive a single index or indicator category/domain score is presented in the methodology document for the Regional Opportunity Index, a project of the UC Davis Center for Regional Change. Namely, using an arithmetic mean suffers from the problem of compensability. That is, a region can score well on an index even if it has a very low value for one indicator, so long as it has a very high value for another indicator that compensates for or offsets the low value. The geometric mean does not have this problem; a high geometric mean requires strong performance on all indicators to achieve a high index or domain score. We agree that a high level of prosperity and inclusion according to our index should require strong performance on all (or most) indicators, and for that reason we also apply the geometric mean.
Indicator data transformations
Most of the indicators used to construct the Racial Equity Index and various scores described above (prosperity scores, inclusion scores, and prosperity scores by race/ethnicity) are figured as rates/percentages. We enter all such variables into the various formulae “as is” without any prior transformation. For median hourly wage, however, we follow the common practice when analyzing income measures by taking the natural logarithm before we enter it into the index calculations. This is done to both normalize the distribution and because it is often noted that the benefits of income exhibit declining returns to scale. That is, the benefit to an individual of moving from a wage of $10/hour to $15/hour is likely to be much greater than moving from $45/hour to $50/hour.
Treatment of missing values
Indicators used to develop the Racial Equity Index and its components are from the National Equity Atlas, and indicator values are not reported if they are based on fewer than 100 (unweighted) survey respondents. In deriving category scores (for Economic Vitality, Readiness, and Connectedness) for prosperity and inclusion, scores are not reported if more than one indicator value is missing in an indicator category. Given that each indicator category consists of three indicators, this means that we only derive category scores if there is valid data for at least two of the indicators. If an indicator category score is missing, we do not derive an overall value for the prosperity score, inclusion score, or prosperity score by race/ethnicity.
Review of Other Indices
At the onset of the project, we reviewed the following indices: the Growth, Prosperity, and Inclusion indices in the Brookings Institution’s Metro Monitor website; the Economic Health and Overall Inclusion indices in a report by the Urban Institute on inclusive recovery in US Cities; the Growth and Equity indices in Equity, Growth, and Community by Chris Benner and Manuel Pastor; The Advancement Project’s Race Counts index of performance, disparity, and impact; and Measure of America’s Human Development Index.
While other indices in the field possess some of the qualities outlined above, none brings them all together. For instance, while all the examples we reviewed derive separate indices for equity and prosperity, except for the Human Development Index, only the Race Counts index and the Urban Institute’s Overall Inclusion index place an intentional focus on racial disparities. While the Human Development index provides separate index values by race and gender, it does not present an index of inclusion that gauges the size of gaps across all groups (making it difficult to understand the overall extent of inequity) and is only available for states. While the Race Counts index and the Overall Inclusion index specifically focus on race, they do not meet some of the other criteria.
The Race Counts index is closest methodologically to the Racial Equity Index in terms of measuring inclusion but is only available for counties and large cities in California and, at least currently, only includes data for one point in time. The Overall Inclusion index from the Urban Institute does a good job of capturing racial disparity in its index of racial inclusion, but there is little consistency between the indicators used to measure economic health (i.e., prosperity) and those used to measure racial equity. It is our view that metrics chosen as valid measures of prosperity should also be considered valid measures for evaluating inclusion. In other words, we want to measure how equitable prosperity is, and if we define “prosperity” differently when measuring equity, then it seems to create an internal inconsistency.