
Introducing Four New Indicators: Median Age, Asthma, Diabetes, and Commute Time
Today we are excited to announce the addition of four new indicators to the Atlas:
- Median Age
- Asthma
- Diabetes
- Commute Time
Here’s what you can find for each of the indicators:
Median age: What’s the average age of residents in your community?
Latinos and other communities of color are comparatively younger than whites in most regions. As younger populations grow increasingly diverse and the senior population remains largely white, ensuring the success of youth of color – our future workforce – will become increasingly important to regional economies.
What it measures
This indicator measures the average age of residents by race/ethnicity.
Key facts
- People of Other/mixed race and Latinos are the youngest racial/ethnic groups in the United States, with a median age of 20 and 27, respectively.
- The median age of people of color is about 13 years younger than Whites: 29 compared to 42 years old.
How to find it
- Click indicators on the navigation bar
- Select the “Median age” indicator under Demographics
- Select “By race/ethnicity” in the breakdowns underneath the chart
- Here is what you will see
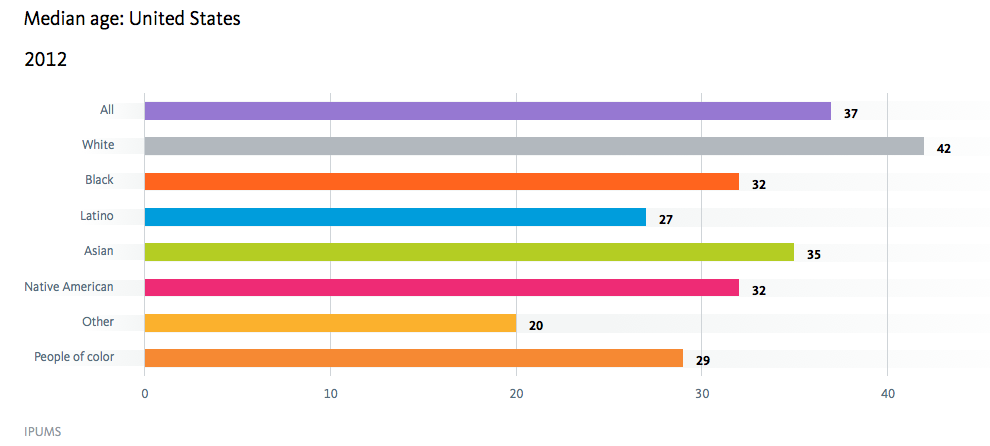
Credit: Median age by race/ethnicy/National Equity Atlas
This data can be used to support strategies that would ensure all youth, including low-income children of color can access the education and supports they need to succeed. For example, the implementation of Universal Pre-K in Tulsa has proven to have strong economic and social benefits, improving future earnings potential by thousands of dollars.
Asthma: What share of adults suffer from asthma?
Healthy workers are critical to a healthy regional economy. However, adult asthma leads to more frequent absences from work, and can result in lower productivity on the job. Asthma is more than a physical health problem; its prevalence and severity are directly affected by environmental, housing and social conditions often present in lower income communities of color. Poor children are more likely to live in neighborhoods with known toxicities and attend schools and recreation centers filled with undetected asthma triggers. As a result, low-income families spend more of their time and limited resources addressing asthma-related hospitalizations.
What it measures
Percent of adults with asthma by race/ethnicity.
Key facts
- Nationally, one in every seven Native Americans and those of Other/mixed race suffer from asthma.
- Among the largest 150 metropolitan regions, Vallejo, CA has the highest share of adults with asthma (14 percent). Yet within the same state, the nearby region of Salinas, CA has one of the lowest rates at 6 percent (ranking 143rd).
How to find it
- Click indicators on the navigation bar
- Select the Equity indicator “Asthma” under Readiness
- Select “Ranking,” “Region,” and “All” in the breakdowns underneath the chart
- Here is what you will see
![]()
Credit: Percent of adults with asthma by race/ethnicity/National Equity Atlas
Data on asthma rates can be used to press for the reduction of hazardous chemicals, pesticides and emissions from industrial plants, automobiles, and diesel engines in your community. It can also be used to call for targeted green jobs and investments in communities with high risks and inequities.
Diabetes: What share of adults are diabetic in your state or region?
Healthy neighborhoods provide residents with access to parks, healthy food, clean air, safe streets, and health care and social services. When communities lack these components, residents are more likely to suffer from chronic diseases such as obesity, diabetes, heart disease, which in turn affect their ability to fully participate in the workforce.
What it measures
Percent of adults with diabetes by race/ethnicity.
Key facts
- West Virginia has the highest share of adults with diabetes: 12.2 percent compared to 9.4 percent nationally.
- Latinos in West Virginia have the lowest rate of diabetes (10.2 percent), compared to 12.2 percent of Whites, and 14.5 percent of Blacks.
How to find it
- Click indicators on the navigation bar
- Select the Equity indicator “Diabetes” under Readiness
- Select “By race/ethnicity” in the breakdowns underneath the chart
- Enter West Virginia in the “Compare” field
- Here is what you will see
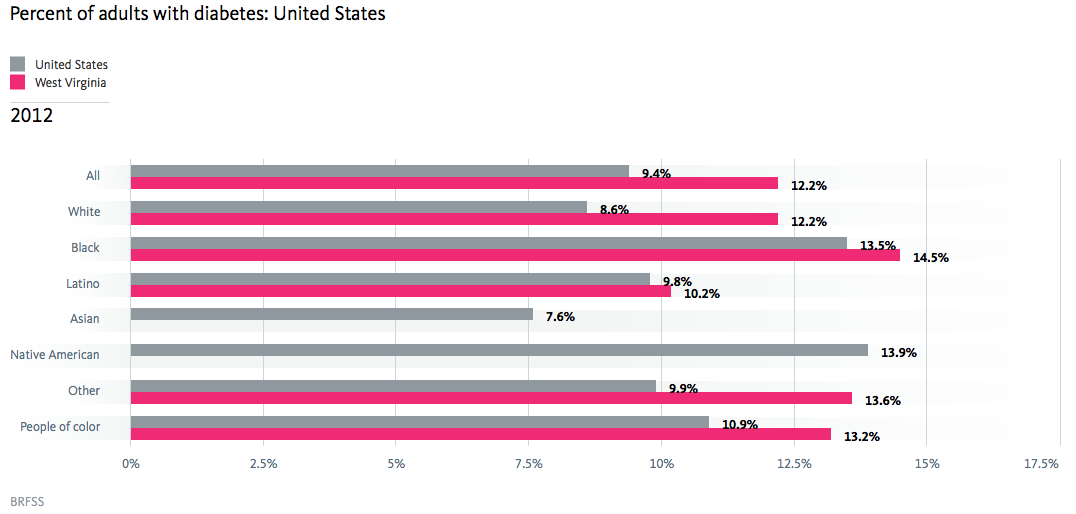
Credit: Percent of adults with diabetes by race/ethnicity/National Equity Atlas
Data on diabetes rates can be used promote healthy eating and active living in your community. Policies and programs that improve the quality of school lunches, access to farmers markets, and create opportunities for physical activity can improve health outcomes for all residents.
Commute time: How does average travel time to work vary by race/ethnicity in your state or region?
In an equitable region, all workers would have comparable commute times regardless of race/ethnicity. Long commute times indicate a lack of nearby job opportunities and slow transit options, and can lead to high transportation and child care costs, job instability, and lower quality of life for workers.
What it measures
Average travel time to work (minutes) by race/ethnicity.
Key facts
- The average commute time for U.S. workers using public transportation is 47.6 minutes, nearly double the commute time of workers using private modes of transit (24.5 minutes).
- Blacks on average have the highest public transit commute times at 50.1 minutes, followed Asians at 48.2 minutes, and those of other/mixed race at 47.9 minutes.
- Commute times vary significantly by geography. For example, public transit users in Nevada on average spend 10 more minutes commuting to work (57.1 minutes). For black workers it’s even longer at 62 minutes.
How to find it
- Click indicators on the navigation bar
- Select the Equity indicator “Commute time” under Connectedness
- Select “By year,” “Public,” and “2012” in the breakdowns underneath the chart
- Enter Nevada in the “Compare” field
- Here is what you will see
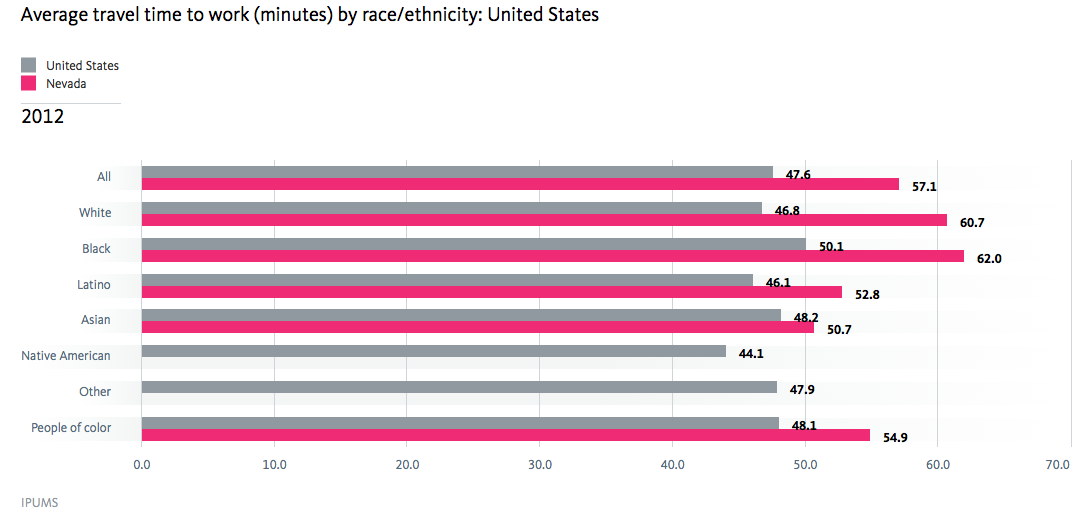
Credit: Average travel time to work (minutes) by race/ethnicity/National Equity Atlas
This data can be used to advocate for the development of robust public transit systems including buses and bus rapid transit that connect low-income communities to jobs, education and training opportunities, and services. Transit-oriented developments (TODs) that include clear equity goals can be an effective tool to expand affordability and access low-income residents and prevent displacement of both people and small businesses.
We hope you'll enjoy exploring these new indicators! Please share your thoughts on these Atlas additions, and tell us how you'll be using this data to inform change in your community. You can contact us at info@nationalequityatlas.org.