
Chart of the Week: #AB1726 in CA Highlights Need for API Subgroup Data
To add equity data to the national dialogue about growth and prosperity, every week the National Equity Atlas team posts a new chart from the Equity Atlas related to current events and issues.
Yesterday, California Governor Jerry Brown signed AB 1726, the Accounting for Health and Education in API Demographics (AHEAD) Act, into law. AB 1726 amends current state code to require the California Department of Public Health to expand the number of Asian and Pacific Islander subgroups for which they collect and report data to also include Bangladeshi, Hmong, Indonesian, Malaysian, Pakistani, Sri Lankan, Taiwanese, Thai, Fijian, and Tongan Americans. The final amendments to the bill removed requirements for public higher education institutions and the Department of Healthcare Services. The University of California and the California State University systems agreed to voluntarily disaggregate Asian and Pacific Islander (API) data, but the California Community Colleges system has yet to signed on.
AB 1726 is a step in the right direction, but all of California’s public higher education and health agencies should report data for more detailed API subgroups, especially because California has the largest and most diverse Asian American, Native Hawaiian, and Other Pacific Islander population.
This week's chart highlights the importance of data disaggregation within the API community, particularly when it comes to higher education, by showing the share of the population ages 25 to 64 with an Associate degree (AA) or higher by selected API ancestry groups.
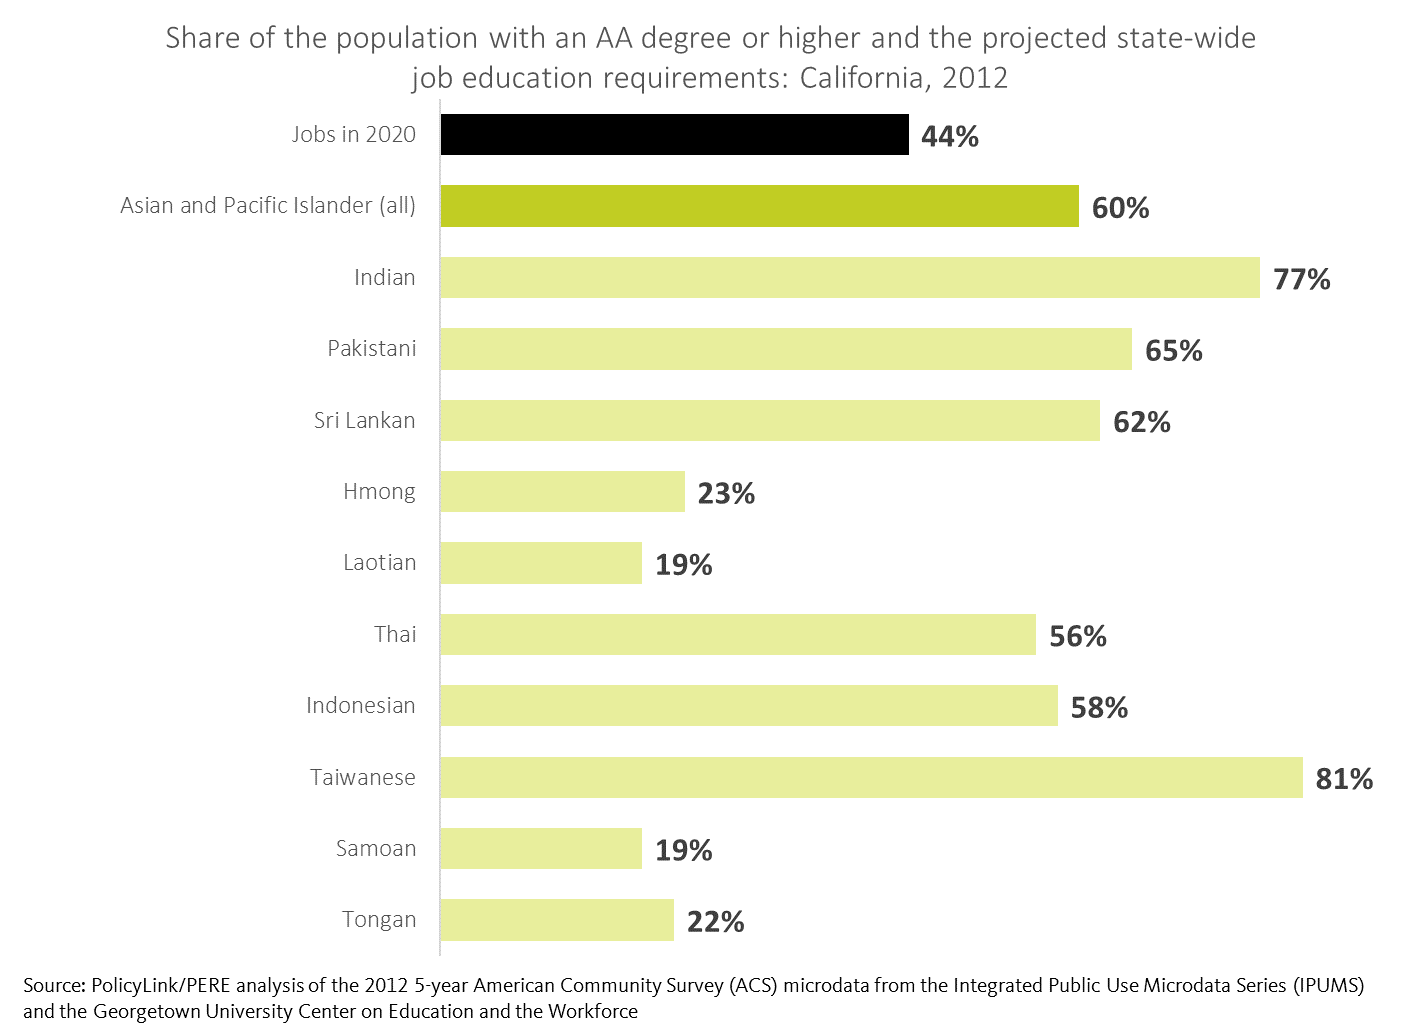
By 2020, a projected 44 percent of jobs in California will require an associate degree or higher. And while 60 percent of the API population as a whole in California has at least an AA, this varies considerably by ancestry. Among Taiwanese people in California, the number is 81 percent, but it drops to 19 percent for Samoans and Laotians. Similarly, Hmong and Tongan Americans have lower levels of education than both African Americans and U.S.-born Latinos. At the other end, Asian Indians and Pakistanis are twice as likely as African Americans and U.S.-born Latinos to have an AA or higher. Less detailed API data can mask barriers faced by certain sub-populations.
For more information about the wide range of outcomes within the API population, check out Asian Americans Advancing Justice’s report A Community of Contrasts: Asian Americans, Native Hawaiians and Pacific Islanders in the West.
To see how educational attainment varies by ancestry in your state or region, explore the education levels and job requirements indicator, type in your state or region in the Explore box, then select the “By ancestry” breakdown. Download the charts and share them on social media using #AllCACounts and #equitydata.