
Exploring Equity Data for Change at Equity Summit 2018
From April 11-13, PolicyLink welcomed over 4,000 equity advocates to Chicago for #EquitySummit2018. It was an inspiring and productive convening, and you can (re)watch the three main plenary sessions here. The Atlas team also organized two equity data workshops, including a pre-summit institute and a strategy session. Here is our recap of the sessions.
Data for Racial Economic Inclusion: Make Your Case
It was a packed house at the pre-summit equity data institute, with more than 100 attendees gathered to learn the opportunities and limitations of local disaggregated data, where they can find publically available local data, and how to build the case for racial equity and inclusion using detailed demographic and economic data.
We began with some education on using disaggregated data. Justin Scoggins, Data Manager at the USC Program for Environmental and Regional Equity (PERE), shared his list of top ten considerations when it comes to working with local and disaggregated data. They include:
- When calculating percentages, try swapping rows with columns (i.e. within the white population in the U.S., only 10 percent are poor. But 44 percent of the poor are white.)
- Showing disproportionality by comparing statistics to a relevant broader population (i.e. If we were looking instead at the share of voters that are people of color, then the more relevant broader population would be all people who are eligible to vote, or perhaps registered voters.)
- Use common sense and intuition. A famous PERE saying: “If you find something interesting/surprising, you are probably wrong!”
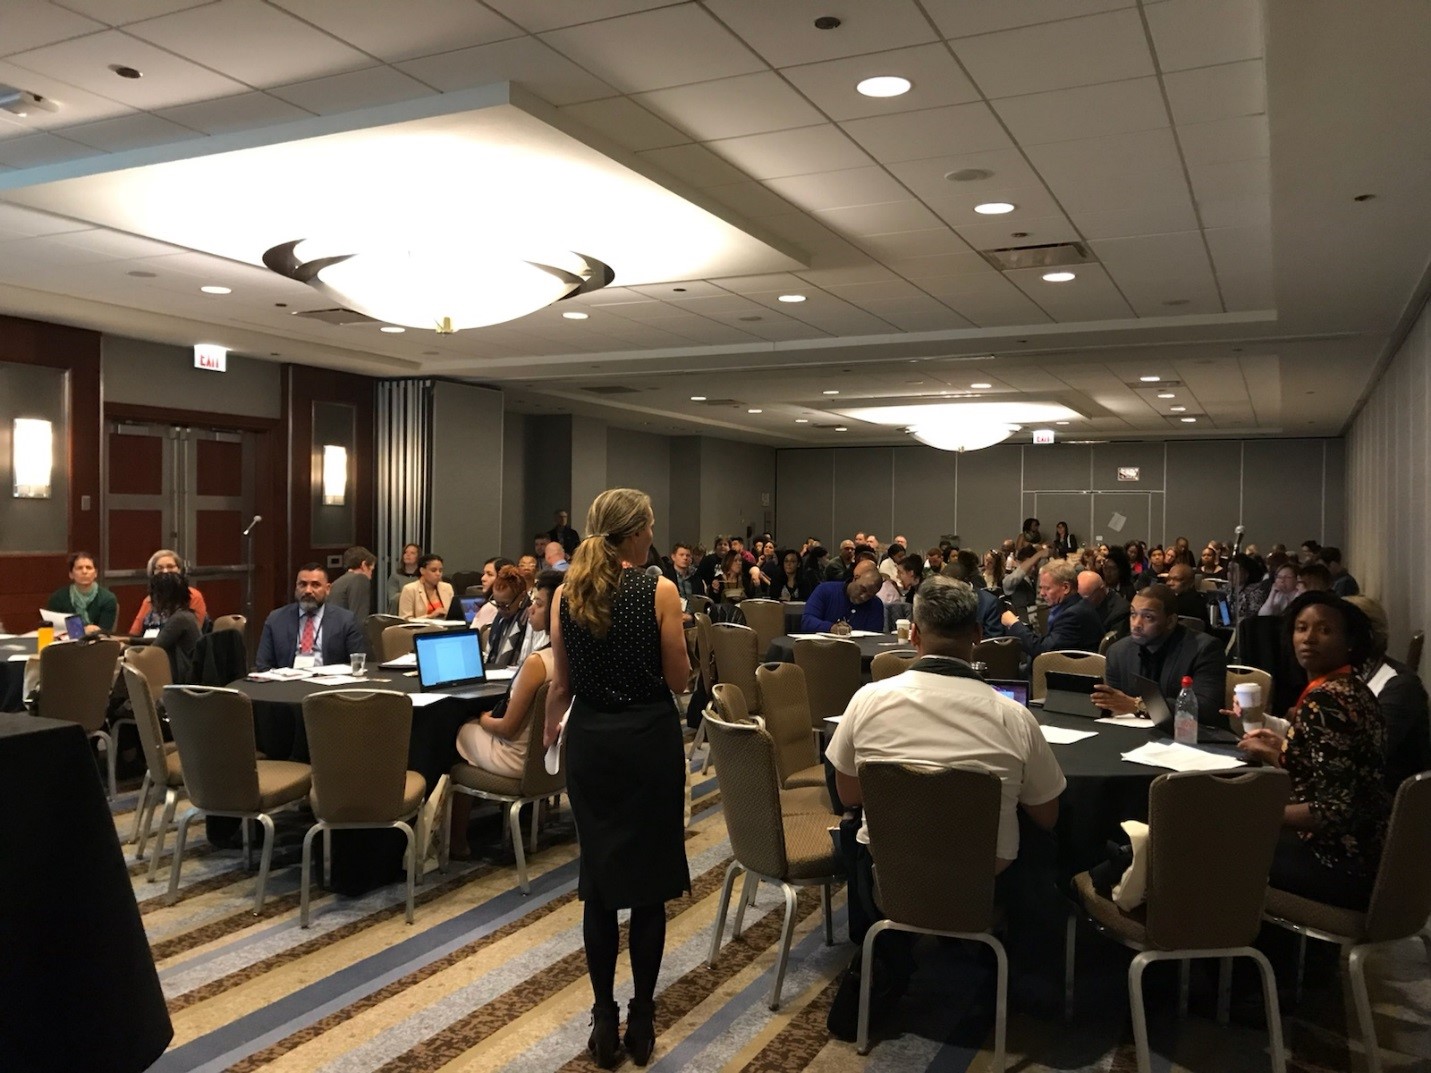
Sarah Treuhaft, Senior Director at PolicyLink, welcoming participants to the pre-Summit Equity Data Institute
Jamila Henderson, Senior Associate at PolicyLink, followed Justin’s presentation with a live walk-through of the Atlas, highlighting unemployment maps of the Chicago region. She showed how even among majority white neighborhoods with relatively low overall unemployment rates, people of color face unemployment rates greater than 20 percent in over two dozen of these neighborhoods.
Following a small group activity, we heard presentations from Adrian Dominguez at the Urban Indian Health Institute and Dolores Acevedo-Garcia from the Institute for Child Youth and Family Policy at Brandeis University. Adrian shared how there are nearly 1.3 million American Indians and Alaska Natives in the United States today and 71 percent live in urban areas. He also shared an overview of the recently released Urban Indian Health Dashboard. Dolores shared about diversitydatakids.org, underscoring how neighborhoods, which are highly segregated by race/ethnicity, are an integral developmental context for children. And a growing body of research suggests that neighborhood environments (e.g., poverty) influence children’s long-term outcomes (e.g., future earnings, college attendance, etc.).
We closed the session in five breakout groups. Dolores led a session on diversitydatakids.org, Adrian led a session on the new dashboard, and we also had a few guest facilitators. Jessica Mindnich and Sepi Aghdaee from The San Francisco Foundation shared about a new project with PolicyLink and USC PERE to build an online Bay Area Equity Atlas covering the nine-county Bay Area region. Karen Shaban and Karla Bruce from Fairfax County, Virginia discussed building the economic case for equity inside county government and their work to get the Board of Supervisors and the School Board to jointly adopt One Fairfax, a racial and social equity policy that applies to all publicly delivered services. Ángel Ross, Program Associate at PolicyLink, shared the Renter Week of Action analysis and how data can support efforts to build renter power in cities across the country.
Leveraging Data to Move Equity Campaigns in an Era of “Alternative Facts”
In this strategy session, we highlighted the work of local leaders crafting data-driven narratives and campaigns despite general hostility towards equity data efforts at the federal level. Participants gathered to strategize on how to better use data to strengthen their work to advance equity and share examples of how they have used data to frame an issue.
We began by sharing our 2017 report on 10 design principles for online health equity data tools. They include the importance of making data actionable through policy and systems change, emphasizing assets and opportunities not just disparities, and honoring indigenous data sovereignty.
Vicki Quaites-Ferris, from the Empowerment Network, presented on how they used the Equitable Growth Profile to inform the Heartland 2050 regional plan in the Omaha-Council Bluffs region. They also created the STEP-UP Omaha initiative, a summer training employment pathway, to reduce unemployment, which was correlated with a decline in gun violence. Go to empoweromaha.com for more on the Empowerment Network, including the upcoming release of an updated profile on June 6.
Later, Neeraj Mehta, from the Center for Urban and Regional Affairs (CURA), shared about how their research approach flips the traditional research approach on its head. Rather than focusing on concentrated poverty, they focus on concentrated White wealth. And rather than relying on research questions generated within the academy, they rely on research questions posed by community members outside the university. Neeraj also shared about a new gentrification analysis in Minneapolis and St. Paul, which found that gentrified census tracts tended to be located along transit corridors. For more on CURA, visit http://www.cura.umn.edu/program-overview. To view Neeraj’s slides, click here.
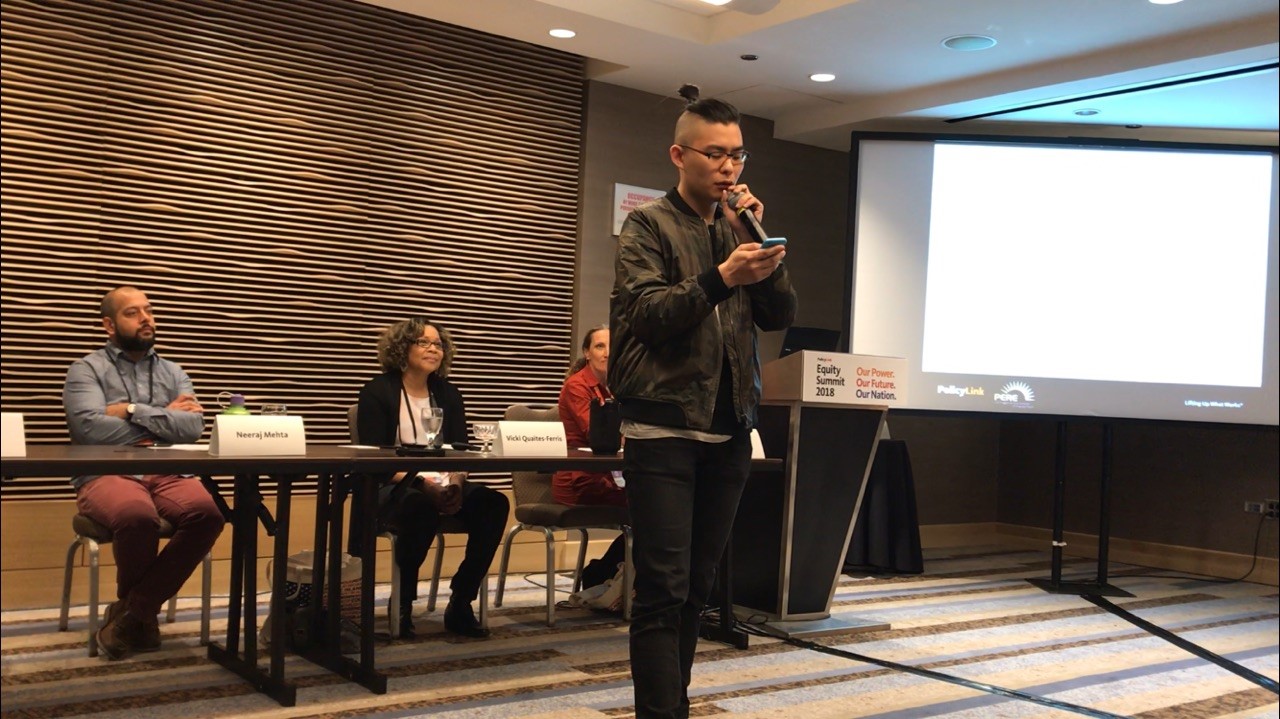
Jihoon Woo, a producer, writer, and artist from New Jersey, opened the session with a powerful piece on truth and facts. Also pictured: Neeraj Mehta and Vicki Quaites-Ferris.