
Chart of the Week: Jobless Growth in Ohio
To add equity data to the national dialogue about growth and prosperity, every week the National Equity Atlas team posts a new chart from the Equity Atlas related to current events and issues.
A couple weeks ago, the Bureau of Economic Analysis (BEA) released its third estimate of second quarter growth in gross domestic product (GDP). Real annualized GDP growth for the nation was 1.4 percent in Q2 up from 0.8 percent in Q1. While GDP is often the measure of economic health and well-being, the nation's recovery from the Great Recession has been characterized as a "jobless recovery," in which job growth has lagged behind GDP growth. In a typical post-recession recovery, macroeconomic indicators of recovery like GDP growth are often accompanied by job growth and declining unemployment, but this hasn’t been the case for many states and regions across the country. To provide context for this new release in one of this year’s election battleground states, this week’s chart looks at post-recession GDP and job growth in Ohio compared to the national average — an Atlas indicator that was just updated today!
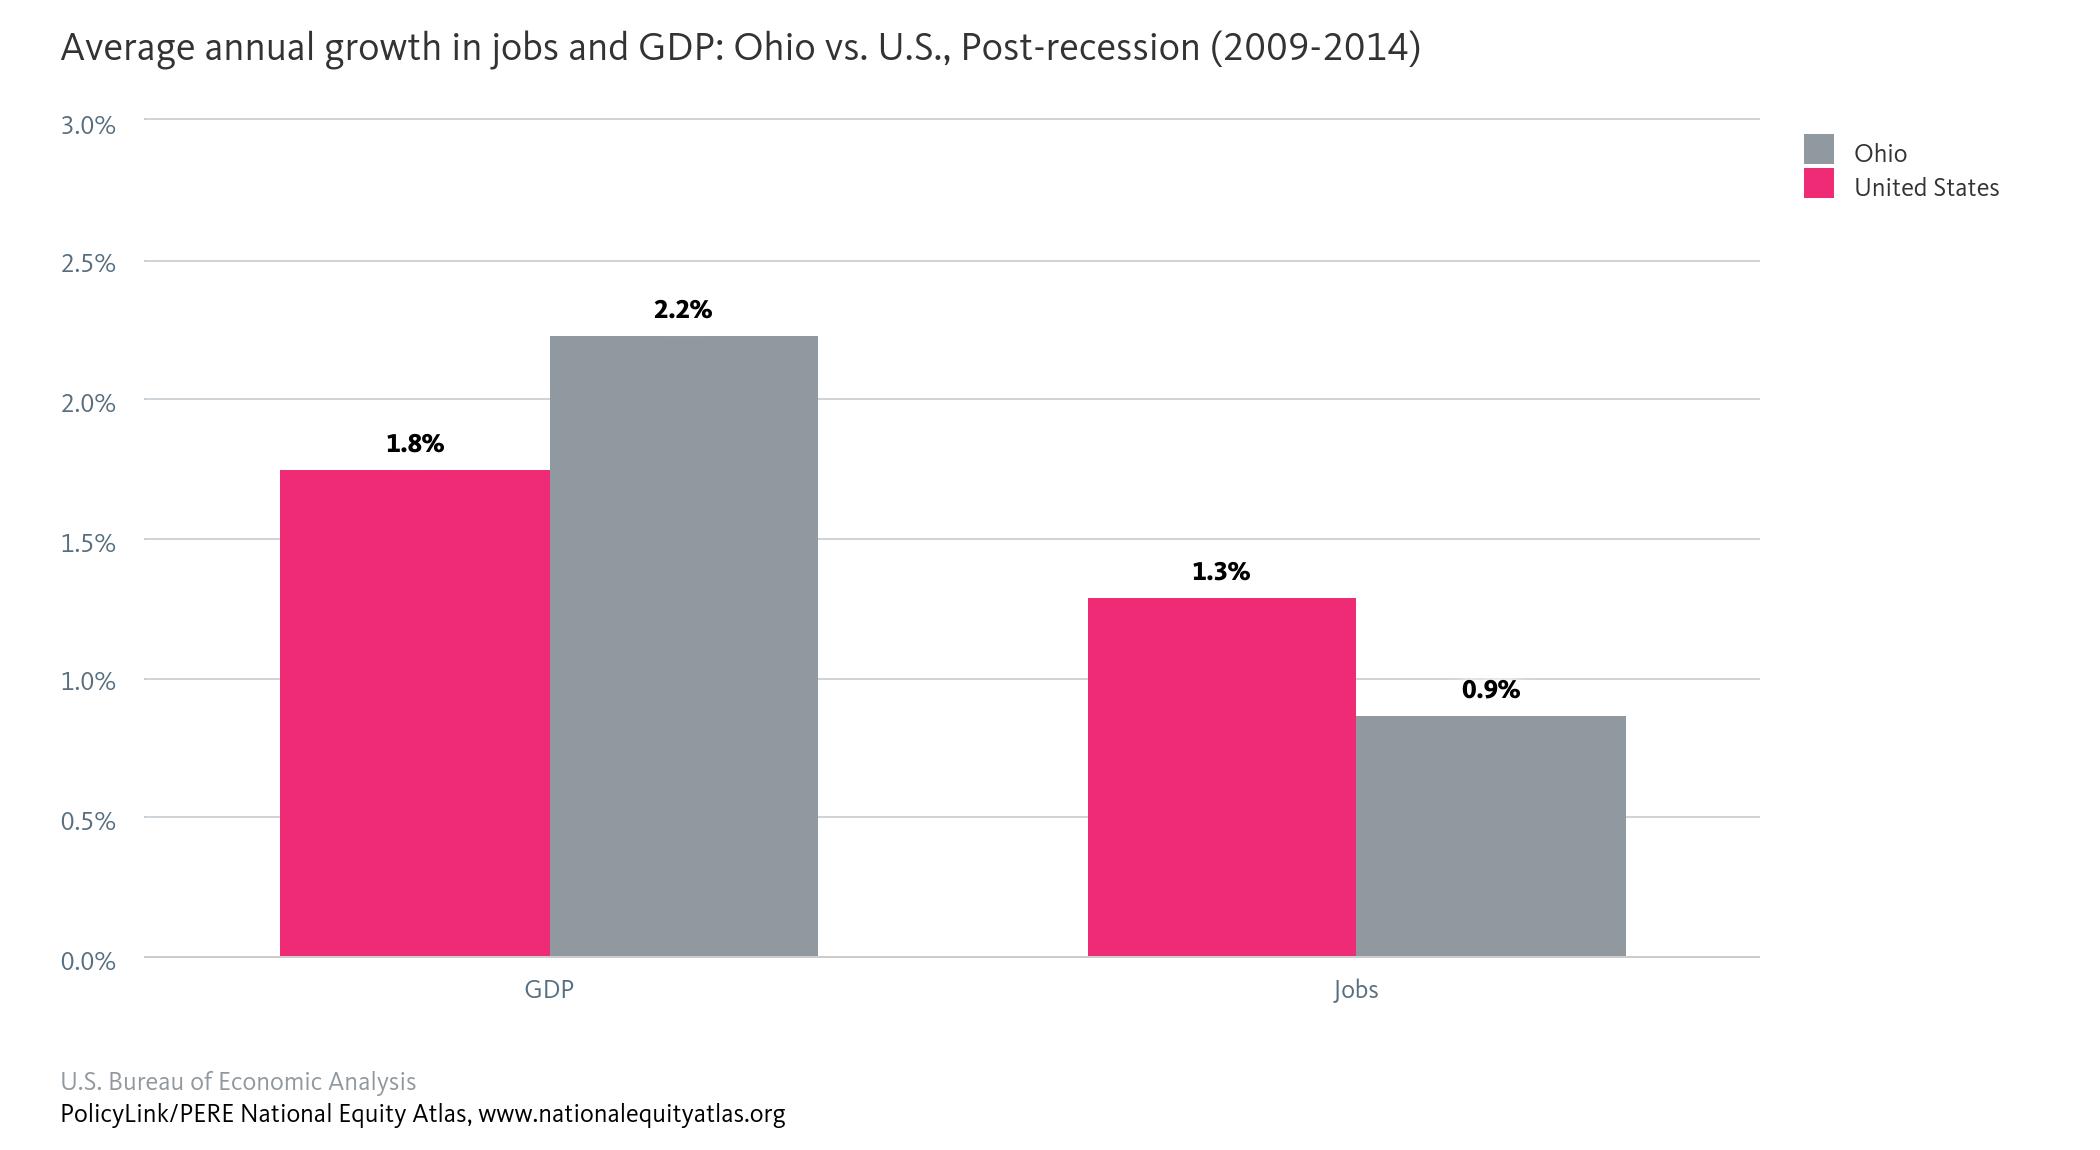
While Ohio’s GDP grew faster from 2009-2014 than that of the U.S. as whole, job growth in the state lagged behind. GDP increased by an annual rate of 2.2 percent in the state compared with 1.8 percent for the nation overall, but jobs grew at an annual rate of only 0.9 percent in Ohio compared with 1.3 percent in the U.S.
Jobless growth indicates that the benefits of an expanding economy are not reaching as many workers and their families as they could be underscoring the importance of growing good jobs for all. Policies that support this kind of growth include building 21st century, resilient infrastructure (with inclusive hiring and contracting), as well as targeting economic and workforce development strategies to grow high-opportunity industries that offer good jobs and careers for people without college degrees.
To view how GDP growth has compared to job growth pre- and post-recession in your region, visit the National Equity Atlas and type in your metro area or state. Download the chart and share it on social media using #equitydata.