The Equity Atlas and DC KIDS COUNT: A Portrait of the Lived Experiences of DC Residents
Here at DC Action for Children, we recognize the power of data, when presented clearly and creatively, to shape the conversations we have about the well-being of children in Washington, DC. Given our interest in the intersection between data and public policy, we wanted to highlight the National Equity Atlas, a fascinating and instructive new data tool created by PolicyLink and the USC Program for Environmental and Regional Equity.
Taking the recent rapid growth of inequality in the America as a starting point, the site explores data on equity related indicators locally and nationally. Similar to our work with the Data Tool 2.0 for DC Kids Count, The Equity Atlas finds creative ways to visually represent data through interactive maps and charts, illustrating how complex issues like demographic and income trends vary over time and geography.
While their focus on income inequality is not explicitly related to children and youth, their work supplements and overlaps with ours. In this blog post, I wanted to highlight some of the Equity Atlas indicators that are especially relevant to understanding the relationship between education and child-well being in the District and inequality. Taken together, the data offered by The Equity Atlas and DC KIDS COUNT present a more encompassing portrait of the lived experiences of the residents of our city.
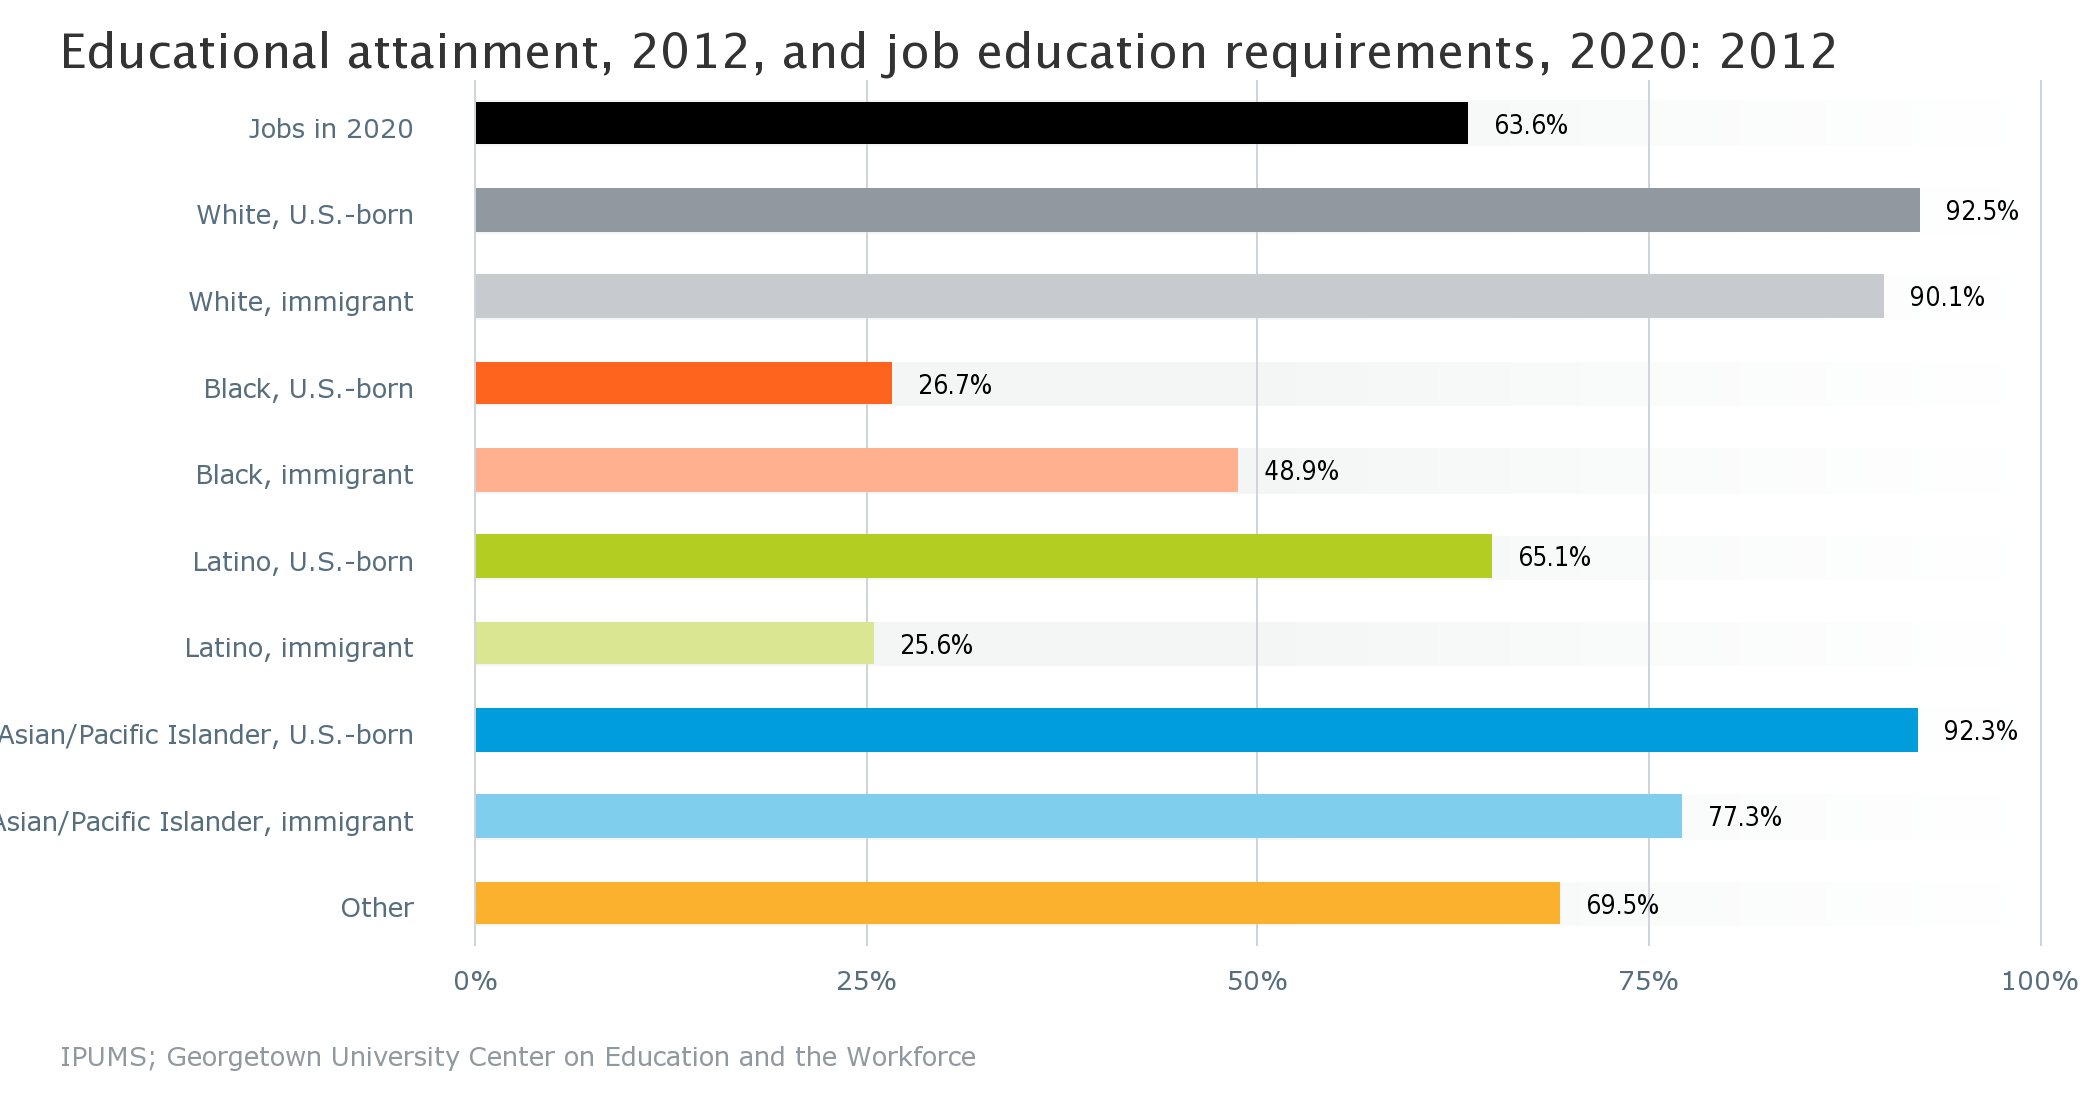
The gaps between the District’s white and minority residents—in both educational outcomes and economic well-being—are the defining challenges facing our city today and in the future. In order to begin closing this income gap, residents of all racial/ethnic backgrounds must have the education necessary to compete for jobs in the changing twenty-first century economy. In 2020, 63.6% of the jobs in the city will require at least an Associates degree, yet only around one-quarter of the District’s native born Black and immigrant Latino/Hispanic residents have the necessary educational attainment to qualify for these jobs.

Credit: Current educational attainment and projected state/national-level job education requirements by race/ethnicity/National Equity Atlas
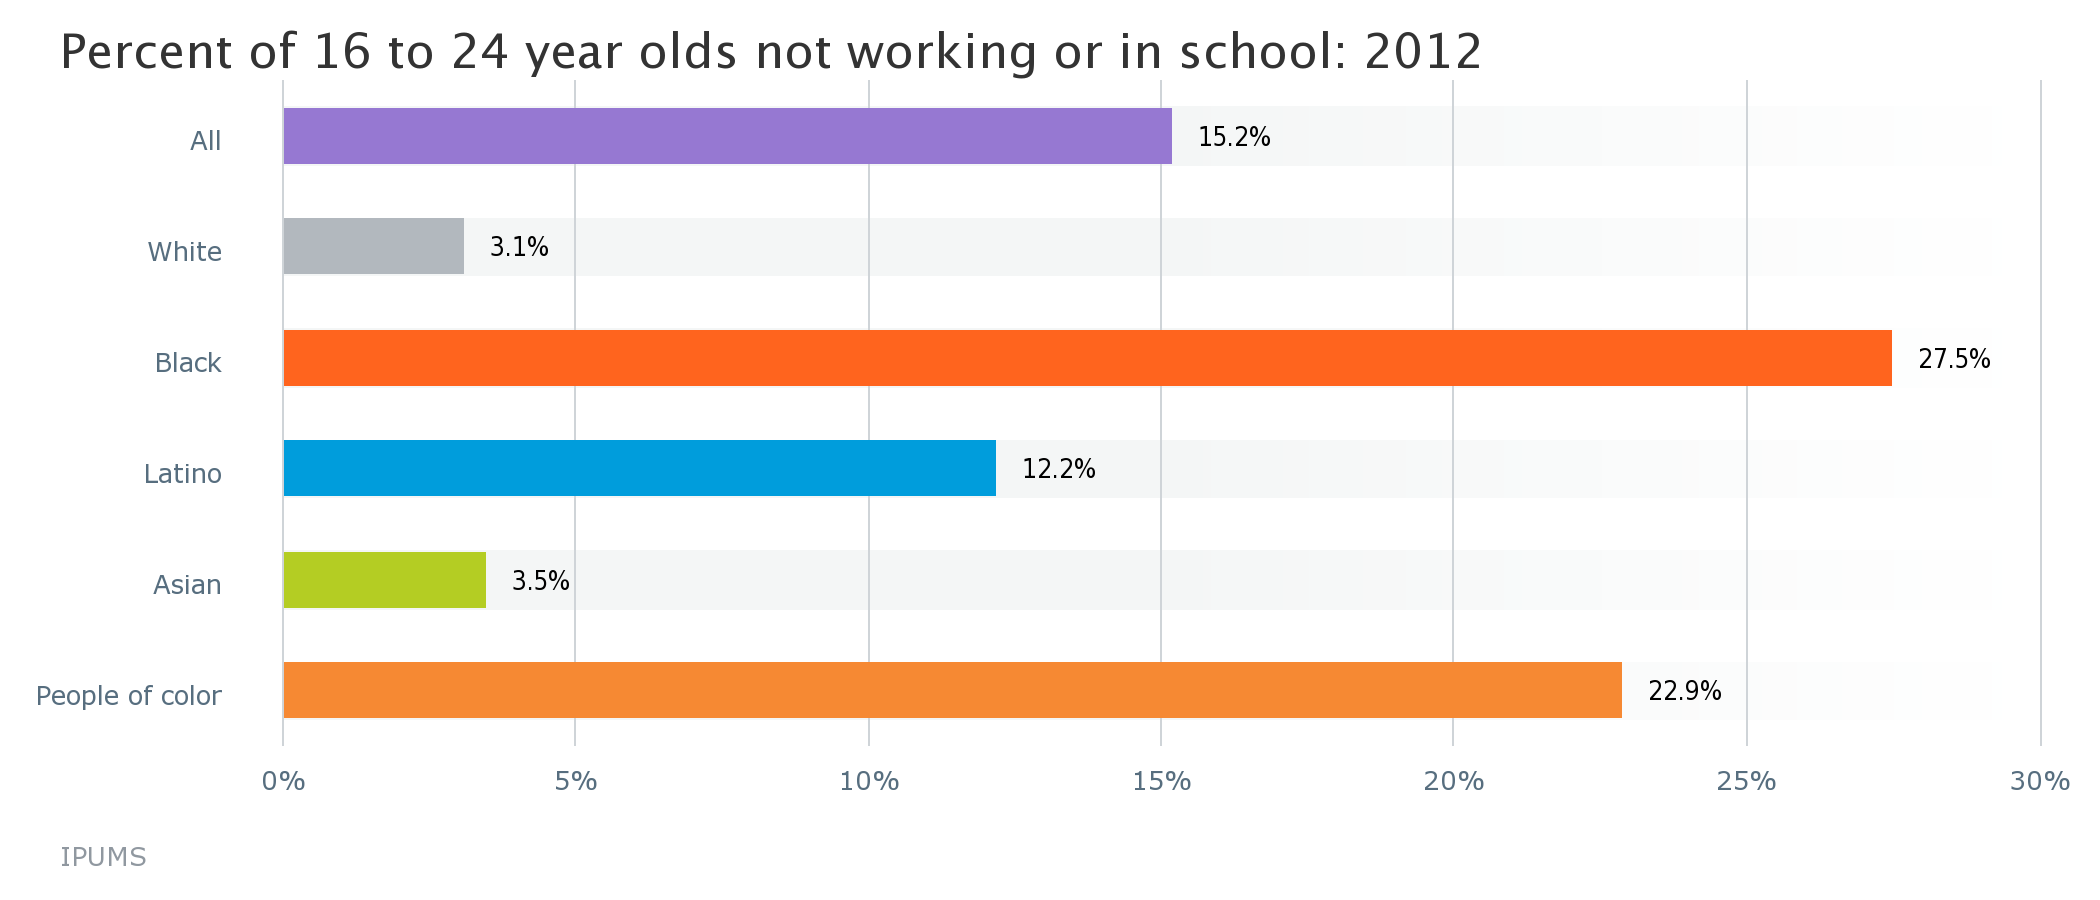
Furthermore 23% of the city’s 16 to 24 year olds of color are unemployed or not in school, a rate more than seven times greater than for white young adults of the same age. Given how interconnected educational attainment and income are, these figures offer a sobering prognostication for income inequality in the future.

Credit: Percent of 16 to 24 year olds not working or in school by race/ethnicity/National Equity Atlas
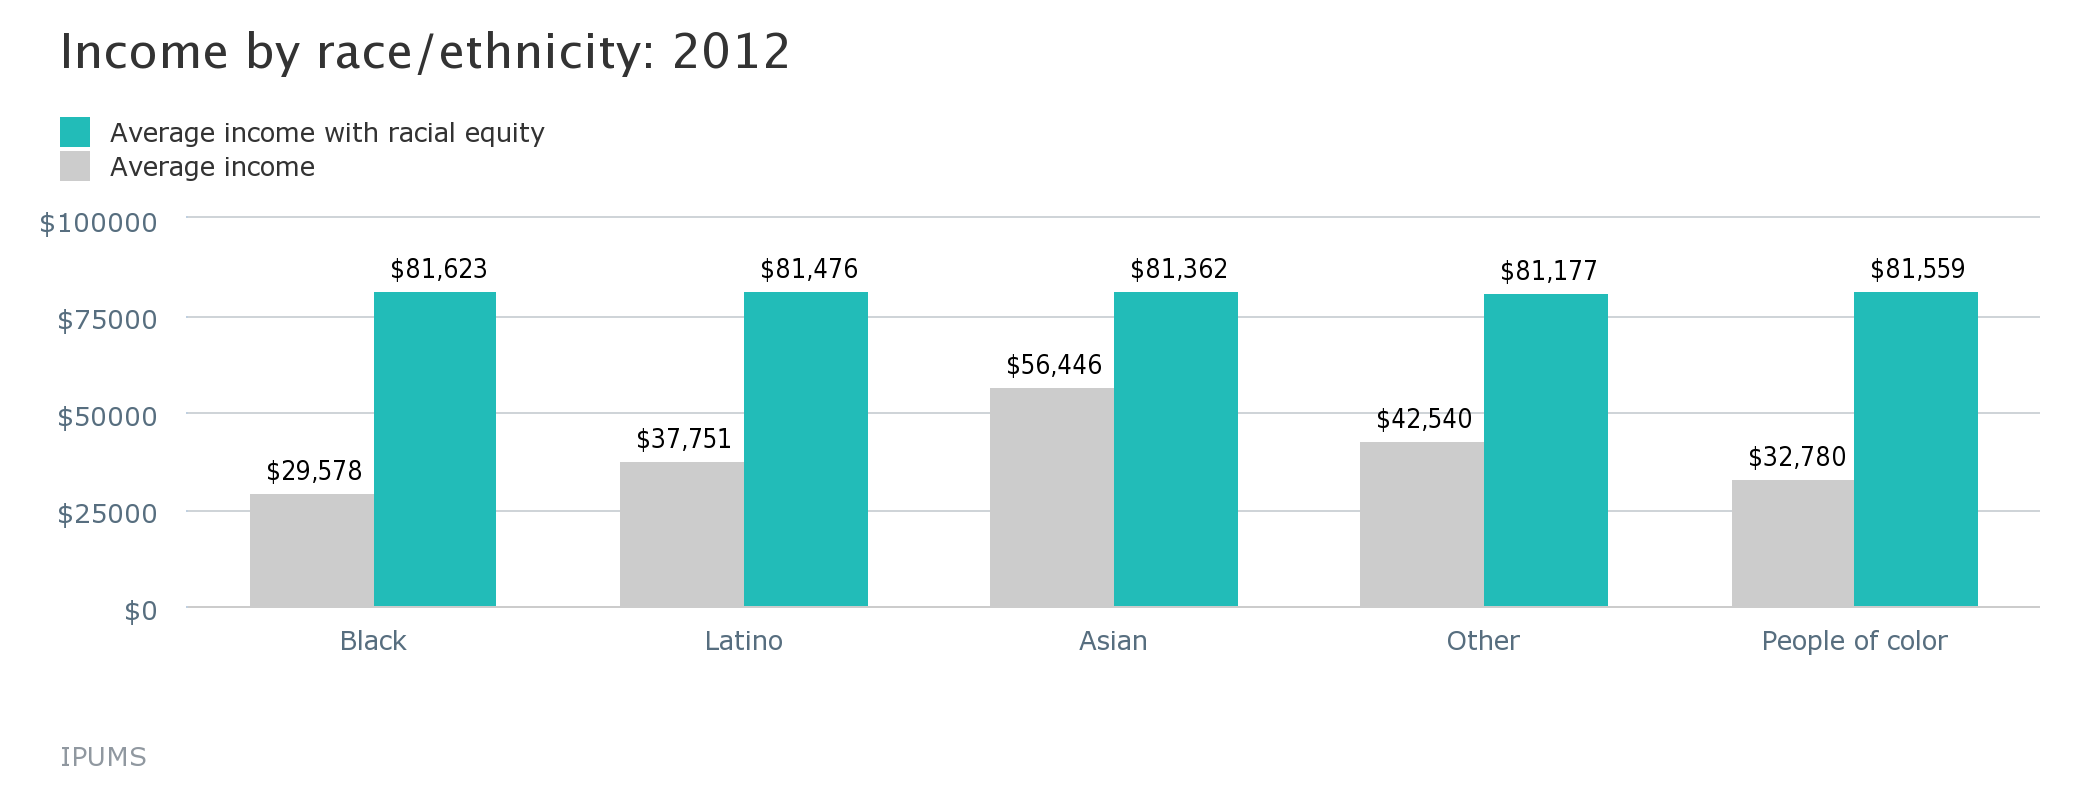
The relationship between economic outcomes and educational attainment is also reciprocal; a 2010 study found that a $3,000 increase in income to a working family between a child’s prenatal year through the age of five is associated with 19% higher earnings when that child reaches adulthood. Closing racial gaps in income and employment would mean a nearly 150% increase in the average income for people of color in the city.

Credit: Income by race/ethnicity/National Equity Atlas
Combating inequality will require a comprehensive approach that includes both a quality education that gives all students the skills needed to succeed in careers when they graduate as well as increased economic investment in the city’s low-income neighborhoods and material assistance to help lift children and their families out of poverty. Our success today will go a long way in determining the type of city Washington will be in the future.