
New Data Highlights Vast and Persistent Racial Inequities in Who Experiences Poverty in America
Already the majority of children under five years old in the United States are children of color. By the end of this decade, the majority of people under 18 years old will be of color, and by 2044, our nation will be majority people of color. This growing diversity is an asset, but only if everyone is able to access the opportunities they need to thrive. Poverty is a tremendous barrier to economic and social inclusion and new data added to the National Equity Atlas highlights the vast and persistent racial inequities in who experiences poverty in America.
On June 28, we added a poverty indicator to the Atlas, including breakdowns at three thresholds: 100 percent, 150 percent, and 200 percent of the federal poverty line. We also added an age breakdown to the new poverty indicator, in response to user requests for child poverty data, which allows you to look at poverty rates across different age groups including the population under 5 and 18 years old as well as those 18 to 24, 25 to 64, and 65 and over.
Why examine different levels of poverty? In 2012, the federal poverty level was less than $12,000 for a single person and roughly $23,000 for a family of four with two adults. Many believe that this is too low. The National Center for Children in Poverty argues, for example, that families need an income at least double the federal poverty level to meet basic needs. Another critique relates to the varying costs of living across communities. $23,000 will go much further in a lower-cost region like McAllen, TX compared with a high-cost one like San Francisco or Washington, DC. To understand the broader universe of families experiencing economic insecurity, this analysis focuses mainly on the population below 200 percent of poverty.
People of color have the highest rates of economic insecurity, while Whites saw largest increase since 2000
Looking at how the share of people living at or below 200 percent of poverty has changed since 1980, we see a few trends. First, economic insecurity (defined in this way) decreased for all racial/ethnic groups except Latinos, who saw an increase of two percentage points over the three decades. During the same time period, Latinos went from just 6 percent of the population to 16 percent and were the fastest growing population over the last decade. In other words, the same demographic group driving growth and change is increasingly experiencing economic insecurity.
Second, the largest overall increases in economic insecurity over the past three decades in the U.S. occurred between 2000 and 2012. During that period, rates increased for all groups except Asian and Pacific Islanders (APIs). Interestingly, Whites have seen the largest increase in economic insecurity since 2000 despite having the lowest rate by far of all major racial groups.
Third, while there are large racial inequities in who experiences economic insecurity, it is a widespread challenge that affects all racial/ethnic groups including Whites. Half of people of color live below 200 percent of poverty compared with only a quarter of Whites but that does not mean Whites are immune to poverty – that percentage represents nearly half of the total U.S. population below 200 percent of poverty.

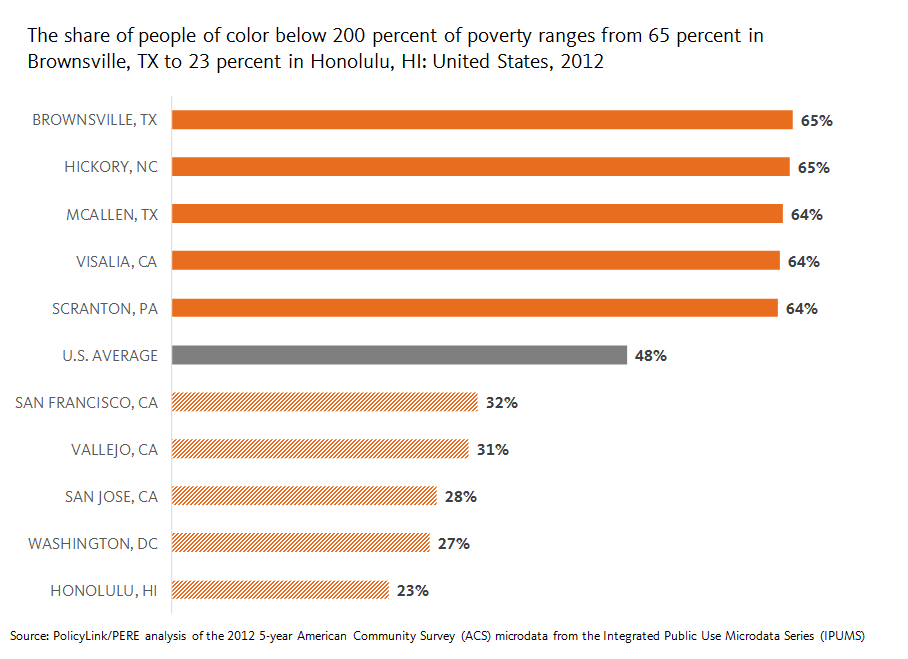
The share of people of color experiencing economic insecurity ranges from less than a quarter of people of color in Honolulu to nearly two in three people of color in Brownsville, TX
While nationally just under half of all people of color fall below 200 percent of poverty, local percentages vary considerably across metropolitan regions, from 65 percent in Brownsville, TX to 23 percent in Honolulu. In order to understand these numbers, it is important to consider the local cost of living, since poverty rates are universal, while costs of living vary tremendously by region. We can do that by looking at “regional price parities" (or RPPs). Calculated by the U.S. Department of Commerce Bureau of Economic Analysis, RPPs indicate relative differences in the cost of goods and services across states and metropolitan areas. They are expressed as a percentage of the average national price level, and range from the highest cost region, Honolulu, at 123 down to McAllen, TX, the lowest cost region in the Atlas, at 84.9.
In general, places with the highest rates of economic insecurity also tend to have lower costs of living: Four out of the five regions with the largest shares of people of color living at or below 200 percent of poverty fall within the bottom third of the 150 largest U.S. metros with the lowest cost of living. And the five regions with the lowest shares of people of color below 200 percent of poverty fall within the 10 most expensive metros in the Atlas. But an affordable rent under this poverty threshold would be less than $1,150 a month for a family of four—which would be nearly impossible to find in these higher cost regions.
The demographic makeup of the regions with the largest shares of people of color experiencing economic insecurity are at both ends of the spectrum: Hickory and Scranton are much whiter than the U.S. as a whole while Brownsville, McAllen, and Visalia are much browner. But they all have one thing in common: people of color are projected to drive the vast majority of population growth over the next couple decades while the White population is expected to decline.
Communities of color are actually the fastest growing segments of the population in most regions, including those with majority White populations, but they continue to face barriers to educational and economic opportunities, stifling their own potential, the potential of the regions where they live, and that of the country as a whole.
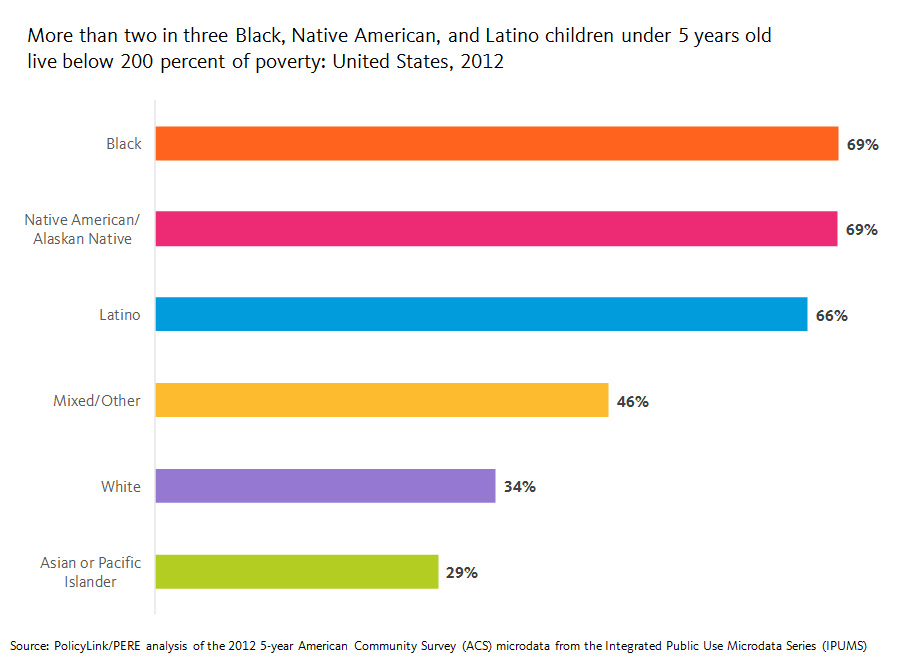
Black and Native American children most likely to experience poverty
When looking at the population under 18 years old, roughly 63 percent of Black and Native American youth live below 200 percent of poverty compared with 31 percent of White and API youth. Children of color are nearly twice as likely as White children to be economically insecure. Even more alarming is that the share of kids under 5 years old, who are already predominately children of color, is even higher. More than two in three Black, Native American, and Latino children under five years old live below 200 percent of poverty. Given what we know about the adverse effects of child poverty, it is alarming that the two largest groups of kids of color, Latinos and Blacks, have the highest poverty rates.
The implications of these findings are far-reaching. Not only will the children of today become the workers of tomorrow, who will be expected to support the growing retired population, but child poverty is also estimated to cost the U.S. economy $500 billion a year, underscoring the importance of racial equity for enduring prosperity. Explore poverty in your city, region, or state here. For more data highlighting the gap between the aging white population and the growing population of youth of color, see the racial generation gap indicator.