Chart of the Week: Transportation Equity is Key to Inclusive Prosperity in the Omaha Region

To add equity data to the national dialogue about inclusive economies, the National Equity Atlas team regularly shares charts produced with data from the Atlas related to current events and issues. Join the conversation on social media using #equitydata.

On June 6, the National Equity Atlas team (and Heartland 2050) released an updated equitable growth profile of the Omaha-Council Bluffs region at “Everyone Prospers: The Path to Equity,” a gathering hosted by the United Way of the Midlands and the Metropolitan Area Planning Agency. In reviewing the data, one of the indicators that stood out as a major challenge to economic opportunity in the region was car ownership.

Reliable and affordable transportation is critical for meeting daily needs and accessing educational and employment opportunities. For households living in regions without robust transit systems, access to a car is critical, but lower-income people, people of color, and some immigrant communities are more likely to be carless.

In the Omaha-Council Bluffs region, spanning 8 counties in Nebraska and Iowa, most households—94 percent—have at least one car (or truck or van). This is similar to other Midwestern metros like Kansas City and Des Moines (see this ranking chart). But there are wide differences by race: Black households are 3 times as likely as the average household to be carless. Furthermore, the Black community is geographically concentrated in the neighborhood of North Omaha where there are fewer employment opportunities and limited transit options.
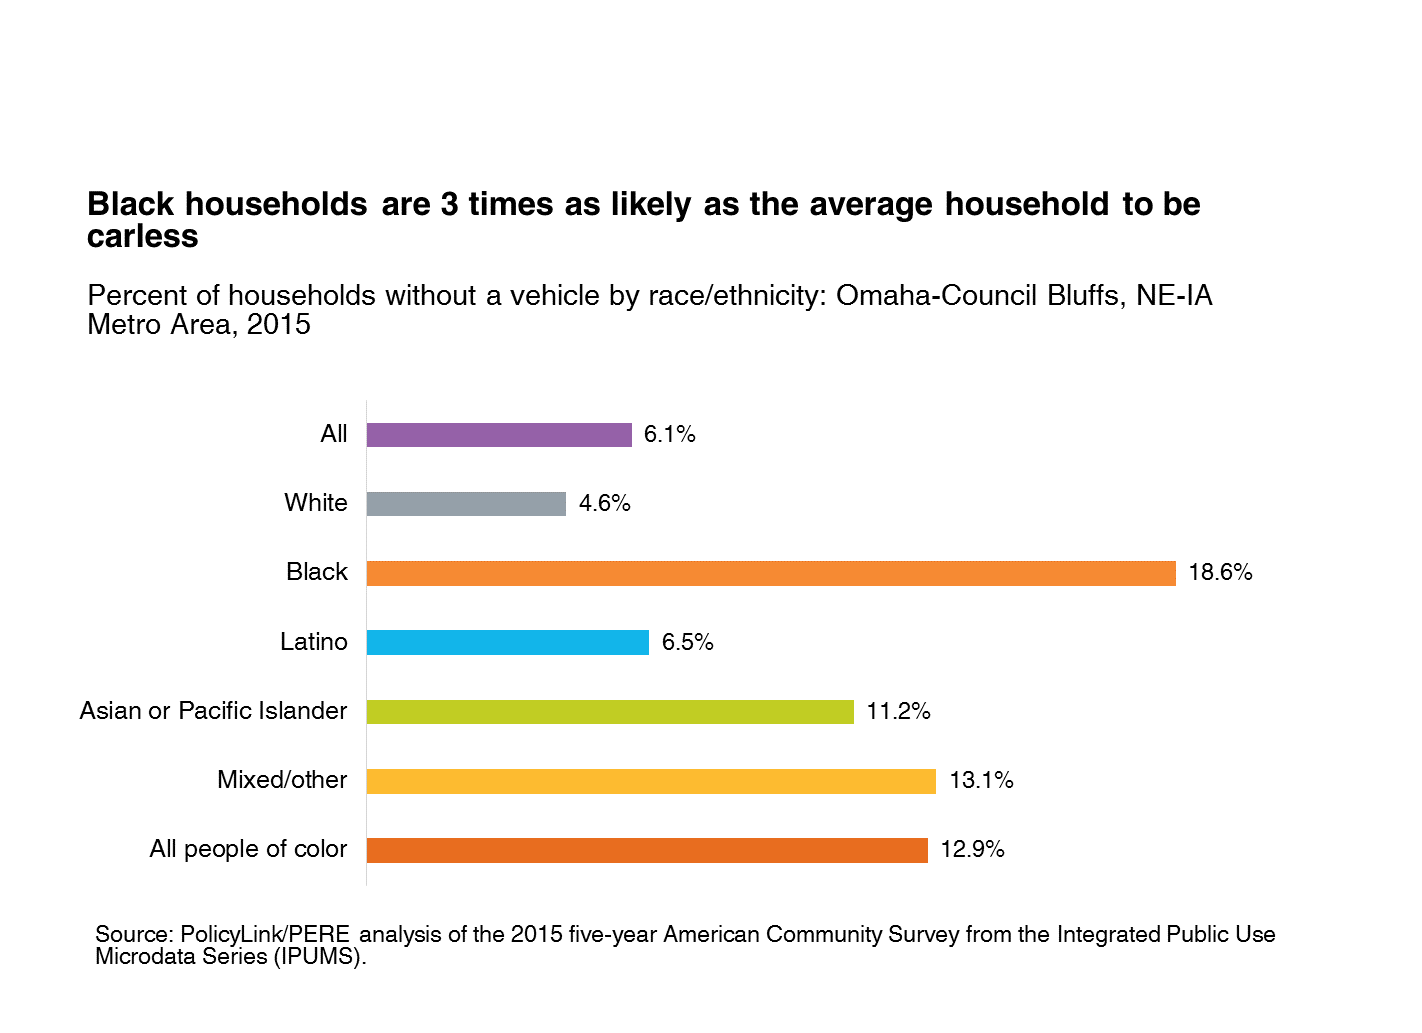
Living outside major job centers with limited transportation options puts these households at a unique disadvantage, especially given that 93 percent of work trips in the region occur by private vehicle. This is according to the region’s Long Range Transportation Plan (which covers the 3 most populous counties in the 8-county Omaha-Council Bluffs Region).

This phenomenon is not unique to Omaha-Council Bluffs. The share of Black households without a car stands at 20 percent for the nation, slightly higher than in Omaha Council-Bluffs (19 percent). Looking at the share of Black households without a car in Omaha-Council Bluffs and over a dozen neighboring regions, Omaha-Council Bluffs falls somewhere near the middle, faring better than some communities (27 percent of Black households are carless in the Minneapolis-St. Paul metro area) and worse than others (15 percent of Black households are carless in the Des Moines metro area).

We also see disparities in car ownership for other communities in Omaha-Council Bluffs. Looking at immigrant and U.S.-born households, the biggest disparity is among White residents: 10 percent of White immigrant households are carless compared with only 5 percent of White U.S-born households.

Bus rapid transit is one strategy to better connect residents to opportunities, and other regions such as the Cleveland metro area, have seen success. In 2008, the city launched its bus rapid transit system, successfully linking the high unemployment, predominantly Black city of East Cleveland to the region’s two largest job centers. To learn more, click here.

To see how car access varies in your community, visit the National Equity Atlas and type in your city or state. Download and share the chart on social media using #equitydata.

Equity Atlas Rent Burden Data Helps Secure Double Policy Wins in Louisiana


Our goal is to put timely local data in the hands of advocates working to make the case for inclusive prosperity in their communities. So we were thrilled to learn that last month, the Greater New Orleans Housing Alliance (GNOHA) used data from our “When Renters Rise, Cities Thrive” analysis to secure policy wins at both the state and local level.

The analysis of New Orleans shows that renters make up the majority of the city’s residents, but 60 percent of them are rent burdened, meaning they pay more than 30 percent of their income on housing costs. If no renters paid more than they could afford on housing in the city, they would see an average increase of $7,200 per household each year.

Last month, the New Orleans City Council addressed one piece of the housing affordability puzzle by banning new entire-home short-term rentals in residential neighborhoods. GNOHA used the fact sheets to advocate in support of the temporary ban (officially called an interim zoning district), highlighting the severity of the rental affordability crisis and the economic benefits of reducing rent burdens across the city.

As Andreanecia Morris, president and Chairwoman of GNOHA, explained to Gambit:

“We are at an important crossroads. We can choose to stabilize our citizens, allow them to contribute to the local economy and change the course of New Orleans’ next 300 years, or we can allow this trend to continue and undoubtedly force more of our people out of the city they call home.”

Meanwhile in Baton Rouge, GNOHA used the same data points for Louisiana to advocate against a state preemption bill (Senate Bill 462) that would have banned local governments from adopting inclusionary zoning policies. The law was an attack on the growing movement to codify New Orleans’ Smart Housing Mix Ordinance, and would have made affordable housing policies voluntary rather than mandated as recommended by the New Orleans’ City Planning Commission and City Council.

Our data shows that renters now make up one in three Louisiana residents, but more than half pay too much for housing. If no renters were housing burdened, they would collectively have an additional $1.5 billion dollars to spend in their communities every year. GNOHA’s arguments did not convince the legislature, which passed the bill. But Governor John Bel Edwards, in response to the tireless advocacy of GNOHA and other local organizations, vetoed the bill last Saturday.

View all of the publicly available fact sheets here

National Equity Atlas: May Update

We hope you enjoyed the long weekend! Our team has been on the road a lot this month, working with partners on the ground in Louisiana, Mississippi, New York, and North Carolina in addition to the Bay Area and Long Beach, and presenting on the Atlas at the National League of Cities in DC. We have also been busy getting ready for some upcoming report releases and crunching data for forthcoming analyses and tools. And we were happy to welcome Sabrina Kim to our team as a data analyst at PERE.

  • Join Our Team: Seeking a Senior Associate in the PolicyLink Oakland Office
    Are you a data geek passionate about racial and economic equity and empowering community changemakers with data? PolicyLink is seeking a senior associate in their Oakland office to join the National Equity Atlas team and manage a project supporting community partners to develop equity data tools. Apply here.


  • The Case for Employment Equity in Mississippi
    Last week we were in Jackson for the release of our new report produced in partnership with the Mississippi Low-Income Child Care Initiative. We found that the state economy could be $2.5 billion stronger each year if unemployment was 4 percent or less for all gender and racial groups and more workers were brought into the labor force. At the event, our partners highlighted how increased funding for child care and more career pathways into good, "middle-skills" jobs for women of color would improve opportunities for those women, their communities, and the state economy. Read Boosting Economic Growth in Mississippi through Employment Equity here.


  • Designing Local Health Equity Atlases in Louisiana and Buffalo
    Earlier this month, we traveled to Louisiana and Buffalo, to facilitate data design sessions with local partners to inform the development of local health equity atlases. In Louisiana, we are working with the Power Coalition for Equity and Justice to develop an online data tool that informs and mobilizes voters across the state. In New Orleans, the Greater New Orleans Housing Alliance is already using data from our renter fact sheets to advocate for renter protections locally and against a state preemption bill. In Buffalo, we are working with Open Buffalo to develop a tool that democratizes data and builds a better understanding of housing, poverty, and transit access as health issues.


  • Chart of the Week: #APAHeritageMonth
    In honor of Asian/Pacific American Heritage month, Jamila Henderson wrote about differences in educational attainment among the Asian and Pacific Islander (API) community in the Los Angeles metro area, where 62 percent of all API working-age adults have at least an Associate's degree, but only 21 percent of those are of Samoan ancestry and 27 percent of those with Cambodian ancestry. In another chart of the week Sarah Treuhaft, highlighted how renter spending power in the Bay Area would increase by $4.4 billion if no renters paid more than 30 percent of their income on housing cost.


Thank you!

The National Equity Atlas team at PolicyLink and the USC Program for Environmental and Regional Equity (PERE)

We're Hiring a Senior Associate, Equitable Economy/National Equity Atlas


PolicyLink is seeking a full-time Senior Associate to join the Equitable Economy team and the formal research partnership with the Program for Environmental and Regional Equity (PERE) at the University of Southern California. The ideal candidate is passionate about producing data and research that is relevant and actionable for those working on the frontlines to advance racial economic equity. 

To learn more about the position visit, careers

National Equity Atlas Webinar Archive

The National Equity Atlas team and partners host webinars on a regular basis to share new data, indicators, and functionalities and to highlight ways of using Atlas data to advance inclusive growth. Below are our webinar archives, organized chronologically by year.

2017

Using Data to Support Organizing and Policy Advocacy: 2017 Renter Week of Action (December 7, 2017) This webinar highlights how data supported and amplified 2017 #RenterWeekofAction efforts in which thousands of people in dozens of cities across the country held actions and assemblies to demand better protections for renters. The National Equity Atlas team partnered with Right to the City Alliance to support these local mobilizations by creating 38 fact sheets highlighting renter economic power and what cities gain by ensuring renter affordability.

Targeted Strategies to Reduce Employment Inequality (March 24, 2017) This webinar highlights findings from the policy brief, Race, Place, and Jobs: Reducing Employment Inequality in America’s Metros, paired with example of effective jobs strategies being implemented by the Northside Funders Group in Minneapolis and the Network for Economic Opportunity in New Orleans.

Beyond a People-of-Color Majority: U.S. Demographic Projections to 2050 (February 15, 2017) This webinar looks at the changing demographics of the U.S. beyond 2044, the year in which the nation will be majority people-of-color, providing a live demo of four indicators that include updated demographic projections to 2050: People of color, Race/ethnicity, Population growth rates, and Contribution to growth: People of color.

2016

Exploring New Neighborhood Maps Added to the Atlas (November 2, 2016) This webinar explores new mapping breakdowns by four indicators (People of color, Race/ethnicity, Unemployment, and Disconnected youth); how to create your own custom maps; and how you can use them to advance equitable growth strategies.

Special Preview: Neighborhood Mapping on the Atlas (October 6, 2016)­ This webinar offered a special preview of new maps will allow users to understand how selected equity indicators vary across neighborhoods within a city or region and can help inform targeted strategies and investments.

3 Ways to Use the New Chart Downloads (September 1, 2016)­ Spotlighting new gender breakdowns for three indicators (Working poor, disconnected youth, and Education levels and job requirements), this webinar describes three simple ways you can use chart downloads available in the Atlas to advance equity in your community.

Explore New Data on Immigrants in the National Equity Atlas (August 8, 2016) This webinar offers tips for accessing disaggregated data in the Atlas to assess how immigrants are fairing in your community, and to develop strategies for immigrant integration and inclusion in your community.

Explore New Equity Atlas Indicators on Poverty and Working Poor (July 12, 2016) This webinar reviews two indicators available on the Atlas - Poverty and Working poor- and further explores policy strategies that can advance racial economic inclusion and equitable growth in your community.

Introducing the National Equity Atlas Data and Policy Tool (June 22, 2016) This webinar features a live demonstration of the Atlas for the grantees of the W. K. Kellogg Foundation.

Exploring New Equity Indicators for Detailed Racial Ethnic Subgroups (May 26, 2016) This webinar reviews detailed racial/ethnic breakdowns to several economic opportunity indicators available on the Atlas, including: Unemployment, Wages: Median, Wages: $15/Hour, Disconnected Youth, Educational Levels, and Homeownership.

2014-2015

Data Tools for Policy Change: Paid Family Leave Policies to Advance Health Equity and Build an Inclusive Economy (December 14, 2015) This webinar was presented by PolicyLink, diversitydatakids.org, and Family Values @ Work, highlighting family and medical leave indicators available on diversitydatakids.org that underscore the intersection of public health and work-family policies as well as the importance of rigorous data on state-level access to family and medical leave.

The National Equity Atlas: New Equity Data for the 100 Largest Cities (September 30, 2015) This webinar highlights the release of data available for the largest 100 cities in the nation to help city leaders champion policies and strategies to counter deepening inequality and build “all-in cities” where all residents—especially those who’ve long been excluded—can participate, prosper, and reach their full potential.

Introducing the National Equity Atlas (December 9, 2014)­ This webinar introduces the National Equity Atlas, a first-of-its-kind online resource for data and policy ideas to build an equitable economy in your region, state, and nationwide.

Data Tools for Change: The Child Opportunity Index (March 18, 2015) This webinar highlights the Child Opportunity Index – a tool from diversitydatakids.org and the Kirwan Institute for the Study of Race and Ethnicity- and how, in conjunction with other neighborhood-level indicators of wellbeing, can arm leaders with data to advance cross-sector efforts centered around child health equity.

Tools for Social Change: The National Equity Atlas (January 28, 2015) This webinar, co-hosted with the National Committee for Responsible Philanthropy, describes the equity framework that undergirds the Atlas, offers a tour of the Atlas, and shares examples of how foundations can employ equity data and policy strategies to foster inclusive growth.

Pages