Introducing New Maps: Unemployment by Neighborhood
This blog provides step-by-step directions for using the new mapping breakdown in the National Equity Atlas. The beta version is now live for the unemployment indicator, and we will be adding maps for three additional indicators next month.
While overall city and regional averages are helpful for establishing a benchmark on an indicator like unemployment — as well as understanding how a place ranks in comparison to neighboring localities or the U.S. as whole — there is often considerable variation within a given place. It’s critical to understand this variation in order to develop targeted strategies that tackle spatial inequities. If a substantial share of the unemployed population lives in just a few neighborhoods, it’s important for workforce development and targeted hiring initiatives to focus on those areas.
How to find the new maps
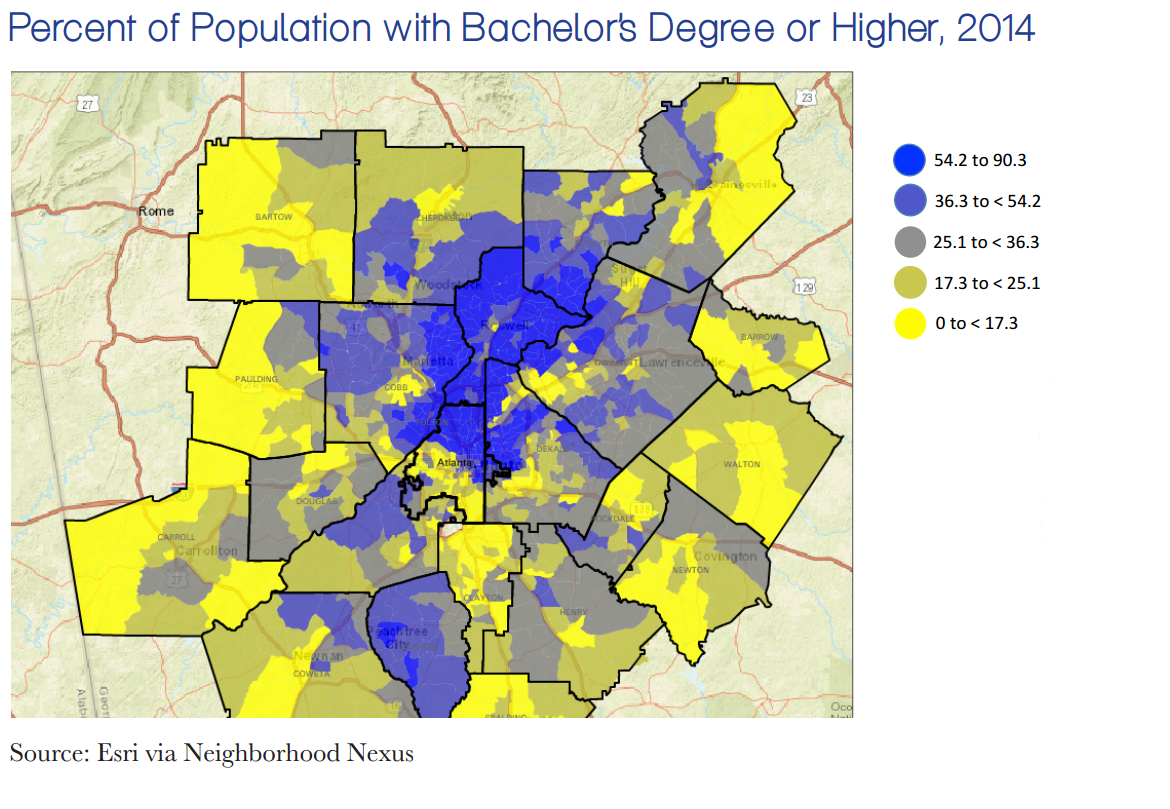
Take the Memphis, Tennessee, metro area as an example. To see the map, go to the Indicators section of the National Equity Atlas and under the Equity menu, select Unemployment. Underneath the graphic display, select the “Unemployment map (beta)” breakdown. Under Geography, on the upper right-hand side of the page, select “Regions” and zoom into Tennessee. As you hover over Memphis, you’ll see that the unemployment rate for the region was 11 percent in 2014 (which reflects a five-year average from 2010-2014).
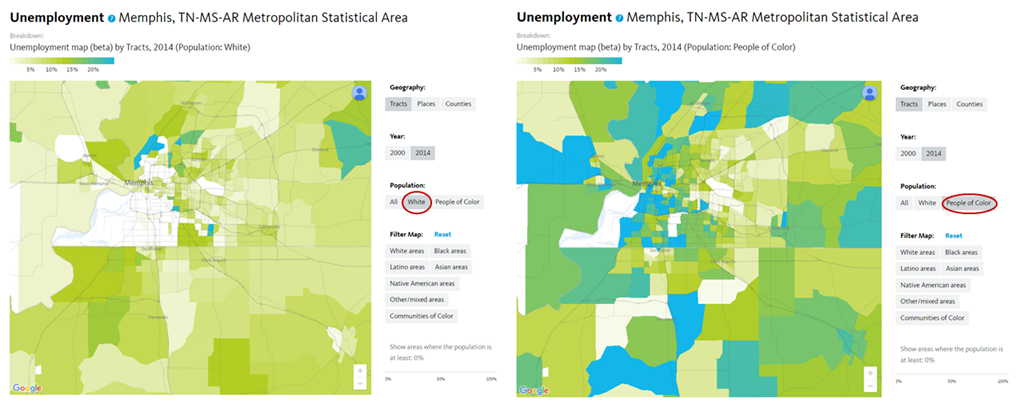
Then in the search box at the top of the page, type in Memphis and select the “Memphis, TN-MS-AR Metropolitan Statistical Area.” The result is a census-tract level map of the region. The overall unemployment rate was 11 percent — but clearly this was not the case across all neighborhoods or across all race/ethnic groups. For Whites in the region, the unemployment rate was 7 percent, while the unemployment rate for people of color was more than double at 15 percent. Similarly, census tract 33 in East Midtown (in Shelby County), which is more than 90 percent White, had an unemployment rate under 2 percent in 2014. Just four miles down the road in South Memphis is census tract 78.21, which is less than 1 percent White, with an unemployment rate of 40 percent (see screenshot of map below).
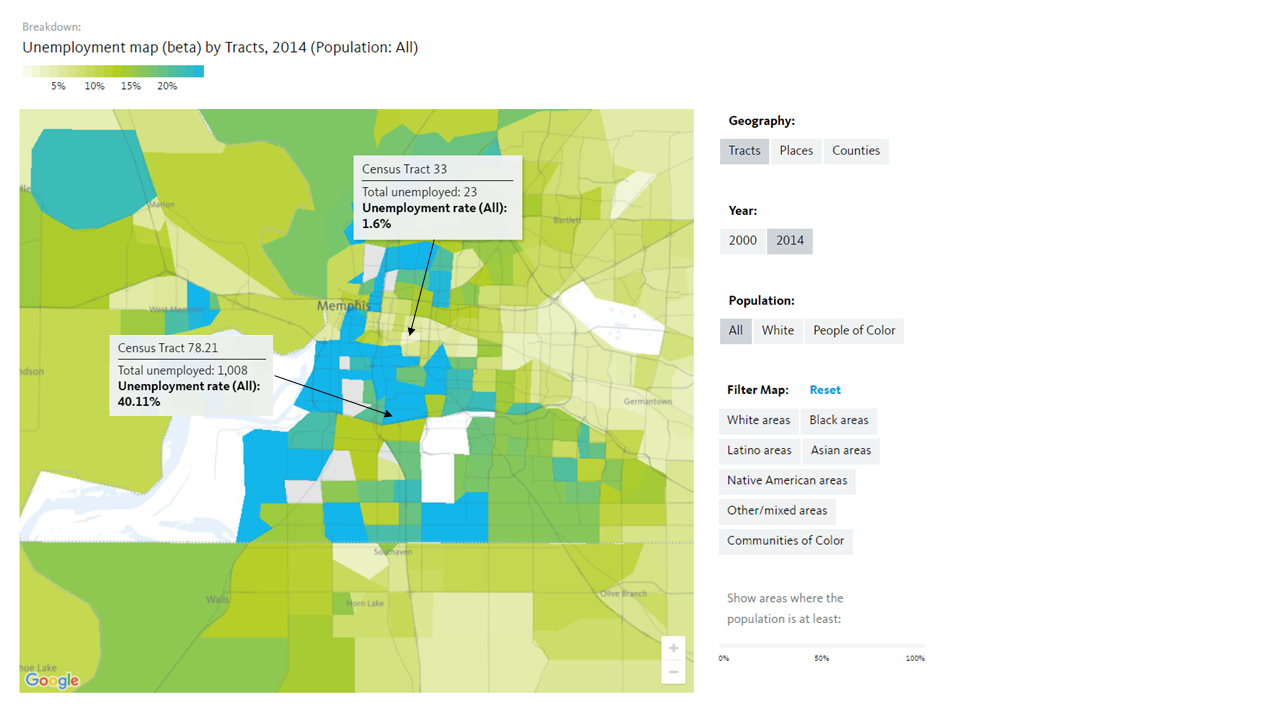
(Note: the census tract level maps are only available at the state, region, or city level.)
As you hover your mouse over a census tract, an info box will appear with the unemployment rate for that tract as well as the total number of people who are unemployed. In Census Tract 33, just 23 people are unemployed, while over 1,000 people are unemployed in Census Tract 78.21. These maps are especially helpful in developing targeted hiring or workforce development initiatives because they allow users to see where such programs would be most impactful.
Comparing over time and across race/ethnicity
Another interactive component of the maps allows users to toggle between geography, years, and race/ethnicity. In the panel to the right of the map are several options: You can view the map by tract, place, or county and you can select data from either 2000 or 2014 to see how the geography of unemployment has changed over time. You can also view unemployment rates for Whites and for people of color independently.
The screenshots below show the unemployment rate for Whites on the left and for people of color on the right. Many tracts in the White unemployment map are blank because there aren’t enough White people living in those tracts to report data. Toggling back and forth between White unemployment and unemployment for people of color provides a clear visual example of persistent racial residential segregation and enduring employment barriers for people of color.
Assessing unemployment in communities of color
The last and perhaps most interactive element of the maps is the race/ethnicity filter. The filters powerfully illustrate both segregation and disinvestment in communities of color. If you select, for example, “Black areas”, then move the scroller at the bottom of the page to 50 percent, you will only see tracts where the Black population is at least 50 percent (see screenshot below). All tracts with a Black population less than 50 percent are greyed out, and you’ll notice that many of the lightest green areas, those tracts with the lowest unemployment rates, disappear. Meanwhile, the darkest blue tracts, symbolizing the neighborhoods with the highest unemployment rates, remain. These maps can inform both infrastructure investments and targeted hiring to ensure that the communities most affected by unemployment are the ones who receive resources.

(Note: the filter only works when the population selected is “All”.)
Explore the maps and share your feedback
It was in response to user requests for county and sub-county data, and data for rural areas, that we added maps by county, tract, and place for the entire country, including areas that are not part of the largest 100 cities or the largest 150 metro areas.
We invite you spend some time exploring this new feature ahead of the public release of maps for three additional indicators (people of color, race/ethnicity, and disconnected youth) at the end of the month. Register for our 30-minute webinar on Thursday, October 6 at 12PM PDT for a more extensive walk-through of the unemployment maps and to share your feedback on the beta version. You can also share your feedback about the maps using our contact form.