Identify Priority Issues for an Equitable Recovery with the New Racial Equity Index for Cities
The 2017 Racial Equity Index rankings offer a unique snapshot of how US cities stack up on overall equity outcomes. Racial Equity Index values for the 100 largest cities ranged from 21 (Detroit, Michigan) to 76 (Irvine, California), indicating that no single place fared the best on every measure (which would have resulted in a score of 100), nor did any place perform the worst on all measures.
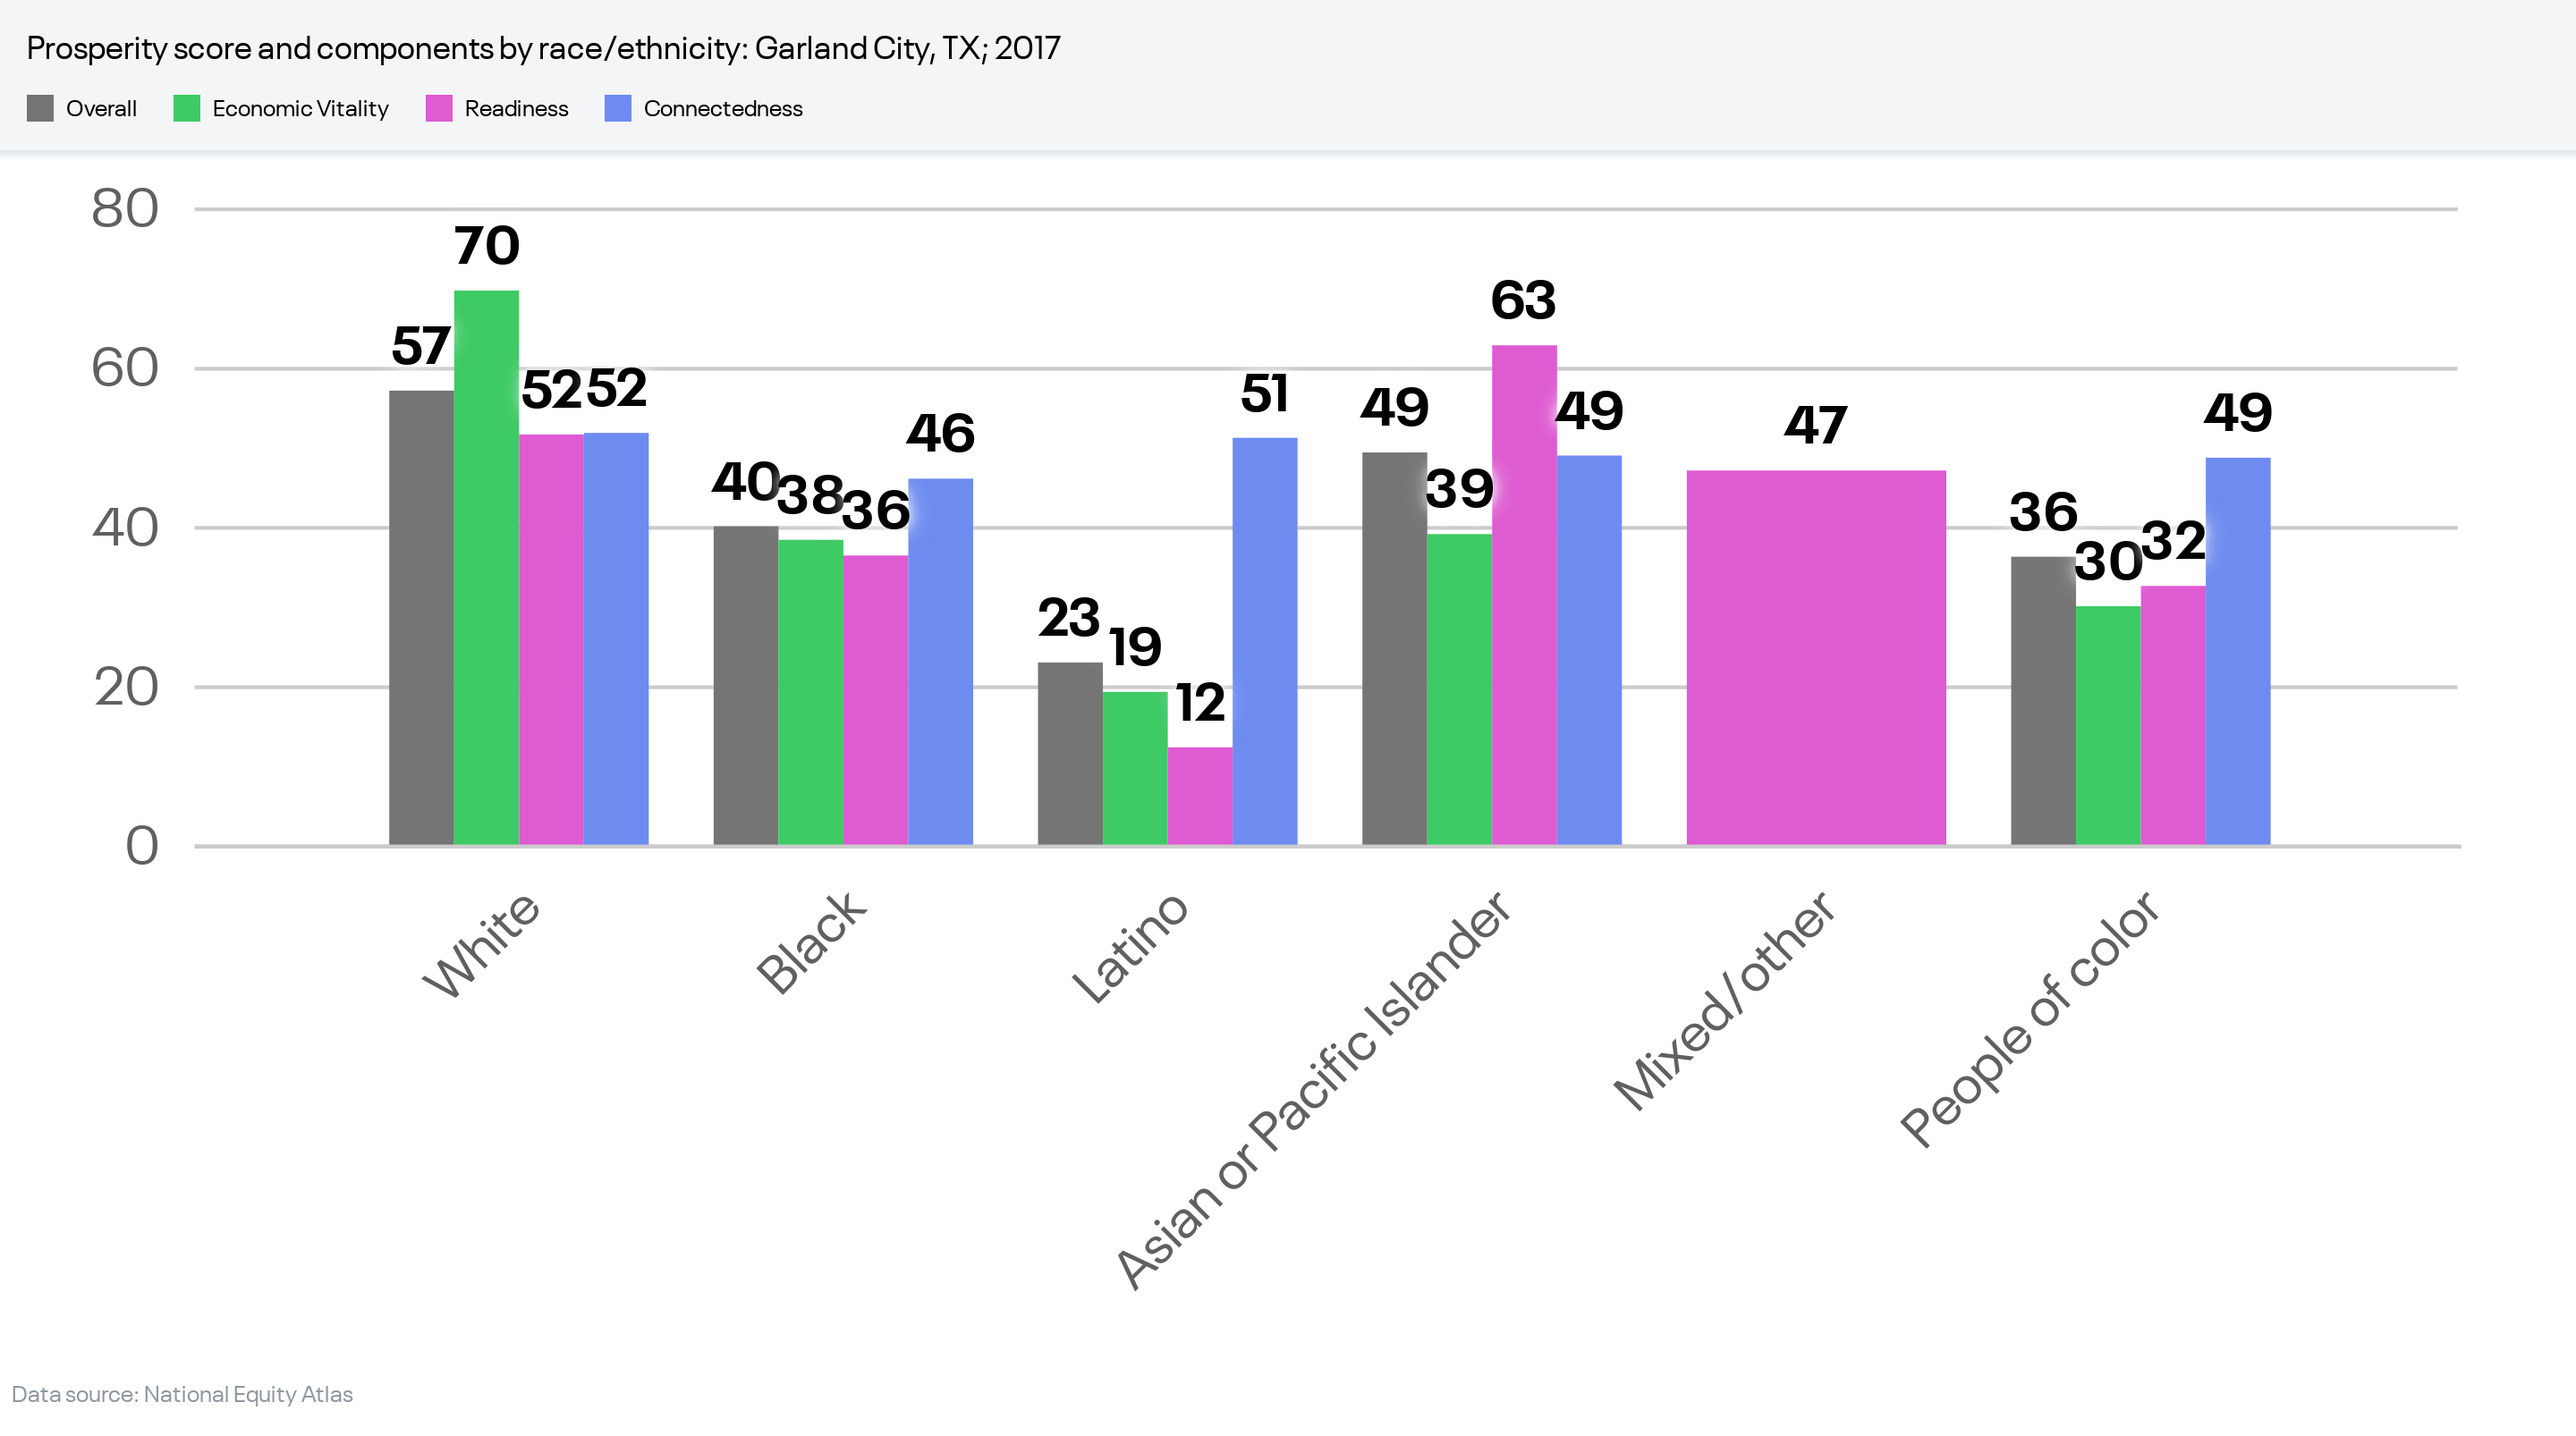
It is important to note that because all values are relative — meaning they measure how well a city is doing compared to other cities — even the top performer has room for improvement. For example, the city-level inclusion scores, which indicate the relative size of racial gaps, ranged from 26 (Scottsdale, Arizona) to 81 (Garland, Texas). But even among cities with high inclusion scores, pronounced racial gaps are evident. In Garland, for example, prosperity is not equitably shared, as illustrated in the chart below. In every indicator category, scores for Black and Latinx residents trail those for the White population.
Latinx residents in Garland experience the deepest inequities in Economic Vitality and Readiness indicators.
The city-level prosperity scores span an even broader range, from 8 (Detroit, Michigan) to 78 (Fremont, California — a Bay Area suburb). This reveals the stark differences in economic and social outcomes in the wake of the Great Recession, as the recovery was very uneven and concentrated wealth and prosperity in a small number of regions (such as the San Francisco Bay Area) while legacy and post-industrial regions continued to struggle.
Top 10 Cities Concentrated in the West and Southwest
The table below shows the top 10 cities on the Racial Equity Index for 2017, as well as the inclusion and prosperity scores for each place. The cities on this list represent a diversity of local economies, from those dominated by manufacturing, transportation, and tourism to others specialized in financial services, energy technology, and aerospace.
Some of the top 10 cities (such as Irvine and Virginia Beach) have high Racial Equity Index scores driven by high scores for both inclusion and prosperity. In these places, overall population outcomes are, on average, better and more racially equitable than in other cities.
Other cities on the list (like Reno and Albuquerque) have high inclusion scores but much lower prosperity scores, indicating that while racial gaps are relatively small in these cities, overall population outcomes trail those in other places.
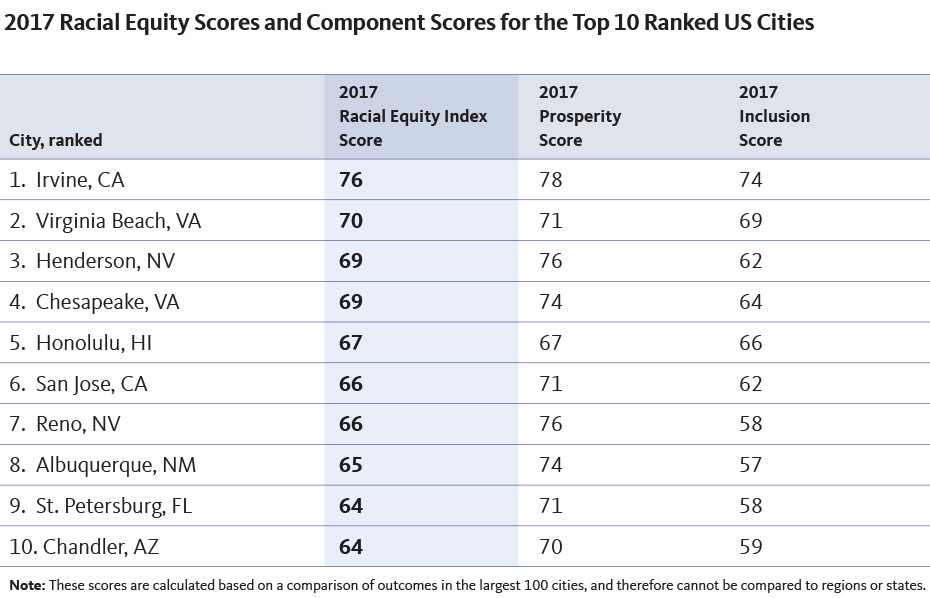
Irvine earned the top spot on the Racial Equity Index for cities in 2017 with the sixth-highest inclusion score among cities and the third-highest prosperity score. In other words, it performed quite well in terms of both overall outcomes and in terms of racial inclusion.
Irvine’s top ranking is driven by its standout scores in the Readiness category: educational attainment, disconnected youth, and school poverty. The city ranked #1 for prosperity (overall outcomes) in educational attainment (BA degree or higher), and #2 for racial inclusion in educational attainment. It was also at the top of the lists for overall lowest levels of school poverty (#1) and disconnected youth (#2).
Yet Irvine is not without its challenges, with average or below-average prosperity scores in the Connected category: air pollution exposure (#51), commute time (#50), and rent burden (#74): more than half of renter households in Irvine spend more than 30 percent of their income on housing costs. And while the city had a high prosperity score for poverty/economic insecurity (#10), it ranked #73 out of 100 for inclusion on the same indicator: 46 percent of Latinx immigrants in Irvine are economically insecure, meaning they have family incomes below 200 percent of the federal poverty level — about three times the rate of US-born White residents (16 percent).
Albuquerque was ranked #8 on the 2017 Racial Equity Index, with the #17 inclusion score and the #32 prosperity score.
The city had slightly above-average prosperity scores (overall outcomes) in median wages (#40) and unemployment (#46), but ranked in the top quarter of cities in terms of racial inclusion for these indicators. The city’s inclusion scores for median wages (#22) and unemployment (#21) signal that Albuquerque has smaller racial gaps for these important Economic Vitality indicators than most of its peer cities. Still, the median wage of Native American workers ($15 per hour) is far lower than that of White workers ($24 per hour). In fact, the median wage for Native American workers in Albuquerque is $2 less per hour than the national average for Native Americans, while the median wages for White, Black, and Latinx workers in Albuquerque are all higher than the respective national averages.
On other measures, however, Albuquerque is less racially inclusive. The city’s inclusion scores were just above average for economic insecurity (#43) and disconnected youth (#44), although 24 percent of Native American youth in the city are neither working nor in school — twice the rate for White youth. And while it scored well on prosperity for air pollution exposure (#17), its inclusion score for that indicator was near the bottom of the list (#93) due to large racial gaps.
St. Petersburg ranked ninth on the 2017 Racial Equity Index for cities, with the #29 inclusion score and the #27 prosperity score.
In 2017, St. Petersburg placed above the median prosperity score for seven of the nine indicators in the index, but landed in the bottom half of cities for disconnected youth (#57) and rent burden (#57).
St. Petersburg’s most positive showing was on the Economic Vitality indicator of economic insecurity. Its prosperity score (#23) and inclusion score (#20) were both relatively high, landing the city in the top 25 for both overall population outcomes and relatively smaller racial gaps in economic insecurity, but steep inequities are still evident: 55 percent of US-born Black residents and 45 percent of US-born Asian or Pacific Islander residents in St. Petersburg are economically insecure, compared to 27 percent of the US-born White population.
St. Petersburg had the nation’s fifth-highest inclusion score for educational attainment, but the share of adults with at least a bachelor’s degree ranged from 15 percent for Black men to 47 percent for Asian or Pacific Islander women.
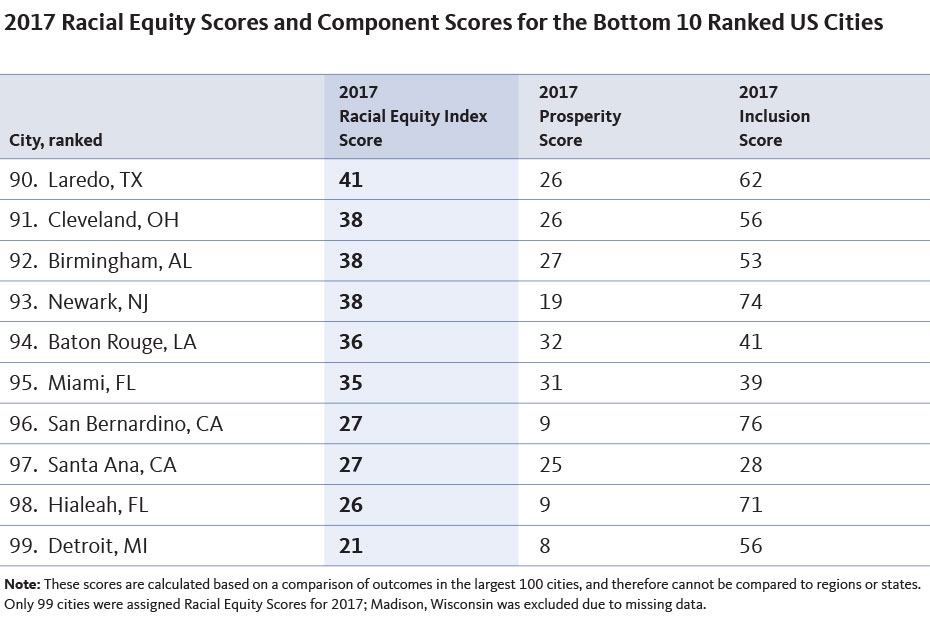
Many Legacy Cities Among the Bottom 10 on the Racial Equity Index
The table below shows the bottom 10 cities on the Racial Equity Index for 2017, as well as the inclusion and prosperity scores for each place. Several of these places could be categorized as “Legacy Cities” that struggled to recover from the decline of manufacturing and significant population loss even before the Great Recession. While a few of these places — Newark and San Bernardino, notably — have high inclusion scores comparable to the top-ranked cities — their very low prosperity scores indicate that their smaller racial gaps are accompanied by widely shared hardship.
In 2017, Baton Rouge was ranked #94 on the Racial Equity Index for cities, with the #91 inclusion score and the #87 prosperity score.
Baton Rouge simultaneously had the lowest prosperity score in the nation for air pollution exposure and the highest inclusion score for the same indicator, meaning the overall outcomes were the worst among the 100 largest US cities, and affected all racial/ethnic groups similarly.
Baton Rouge’s highest prosperity scores were for commute time (#23) and disconnected youth (#29), indicators that returned two of the city’s lowest inclusion scores: #75 for commute time and #98 — last place — for disconnected youth. Overall, 11 percent of youth in the city are neither working nor in school, but the share varies tremendously by race: among Black youth in the city, 20 percent are disconnected from work and school — 10 times the rate of their White peers (2 percent).
96. San Bernardino, California
In 2017, San Bernardino had the ninth highest inclusion score among the 100 largest cities, but the third lowest prosperity score. San Bernardino trails behind almost every other large city for overall population outcomes.
San Bernardino landed among the bottom five lowest prosperity scores on seven of the nine index indicators, but White residents — who make up just 15 percent of the city’s population — fare much better than other racial/ethnic groups. In 2017, the prosperity score for the White population in San Bernardino was 33 — far below the national median, but significantly higher than the scores for the Black (10) and Latinx (9) populations in the city.
Detroit ranked at the bottom of the 2017 Racial Equity Index for cities, with the lowest prosperity score and the 26th lowest inclusion score. In essence, overall population outcomes in Detroit are the worst in the nation, and racial inequities are especially pronounced.
The city’s low prosperity score is driven by the Economic Vitality indicators (median wage, unemployment, economic insecurity) and the Readiness indicators (educational attainment, disconnected youth, and school poverty). Detroit ranked in the bottom seven out of 100 cities on all of these indicators. Economic insecurity has increased significantly for all racial/ethnic groups in Detroit over the past few decades: in 2017, 72 percent of Asian or Pacific Islander households and 72 percent of Latinx residents in the city had family incomes below 200 percent of the federal poverty level, along with 62 percent of Black residents and 59 percent of White residents.
Targeted Solutions that Prioritize the Most Impacted Communities Are the Key to Thriving, Equitable Cities
Strategies tailored to advance just and fair inclusion for the communities most impacted by structural racism and economic inequality are not only the morally right thing to do — they are also the best way to ensure greater prosperity and well-being for all. Directing resources and innovation to where the need is greatest can create tremendous benefits that cascade up and out to the advantage of an entire city. But entrenched racial inequities are often obscured in policymaking and public discourse, making it difficult to home in on the systems and populations that ought to be prioritized. The Racial Equity Index offers an innovative tool to unlock the power of disaggregated data and make the case for policies to cultivate equitable cities where all people can participate, prosper, and reach their full potential.