Now on the National Equity Atlas: Nativity Cuts Added to Eight Indicators
From the high-skilled workers who contribute to groundbreaking research and innovation, to day laborers who are the backbone of the economy, immigrants have played a critical role in positioning the U.S. as a world leader on many fronts. In a context of increasing xenophobic sentiment, understanding the economic engine that is the immigrant population in the U.S. and ensuring immigrant integration is an important cultural, political, and economic imperative.
Understanding the characteristics of the local immigrant community is critical to developing effective strategies to help newcomers reach their potential, and that is why we added new nativity breakdowns to eight economic opportunity indicators in the National Equity Atlas: median wage, unemployment, the percentage of workers making $15/hour, disconnected youth, homeownership, educational attainment, poverty, and working poor. With these breakdowns, you can find out how immigrants are faring in the largest 100 cities, largest 150 metros, and all 50 states.
This is a treasure trove of data for you to explore. Below, we describe a few highlights from our own review of this new data.
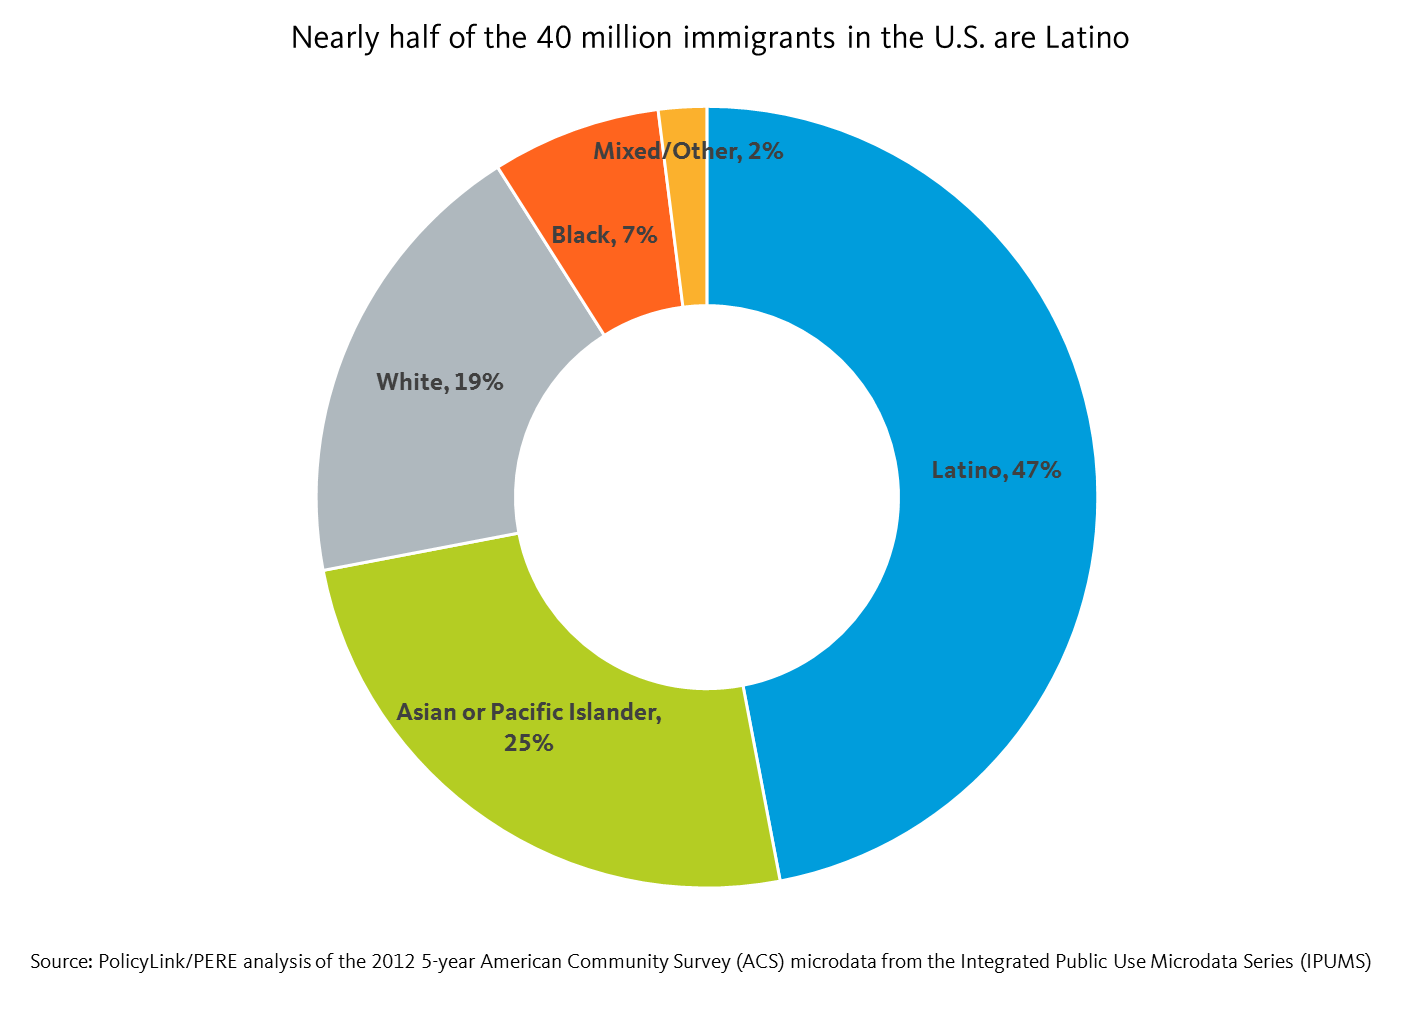
An overview of the 40 million immigrants in the U.S.
There are 39.8 million immigrants in the U.S., representing 13 percent of the total population. Latinos make up nearly half (47 percent) of the immigrant population followed by Asians and Pacific Islanders (API) who account for another 25 percent. This is a testament to the growing body of Latinos and APIs residing in the U.S. White and Black immigrants follow at 19 and 7 percent respectively.
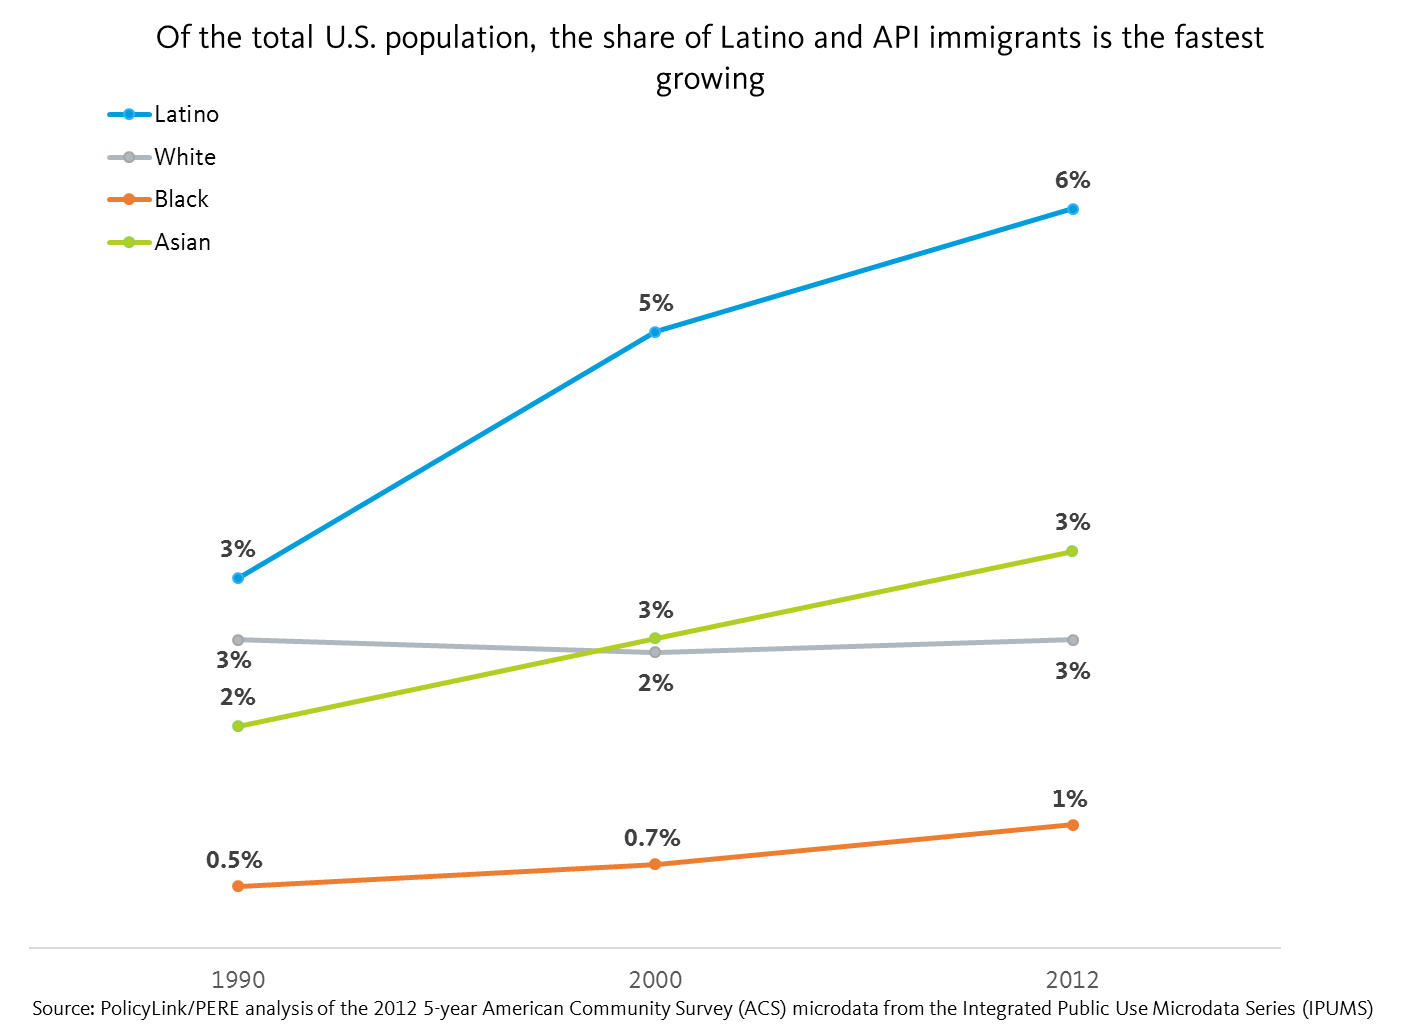
 Latino immigrants made up 3 percent of the total U.S. population in 1990, a figure that doubled to 6 percent by 2012. Latino immigrants represent not only the largest share of immigrants in the U.S., but also the fastest growing. The API immigrant community is the second fastest growing and represent 3 percent of the total U.S. population as of 2012. White immigration has more or less stayed stagnant at 3 percent between 1990 and 2012. Finally, Black immigrants make up the smallest share of the total U.S. population at 1 percent, and are not growing as fast as their Latino and API immigrant counterparts.
 Despite their numbers, Latino immigrants face some of the largest barriers to inclusion. For example, they have the lowest median wage at less than $13/hour, which is $5/hour less than U.S.-born Latinos and half the median wage of White immigrants. Furthermore, 57 percent of Latino immigrants are living under 200 percent of poverty, and 25 percent are working poor.
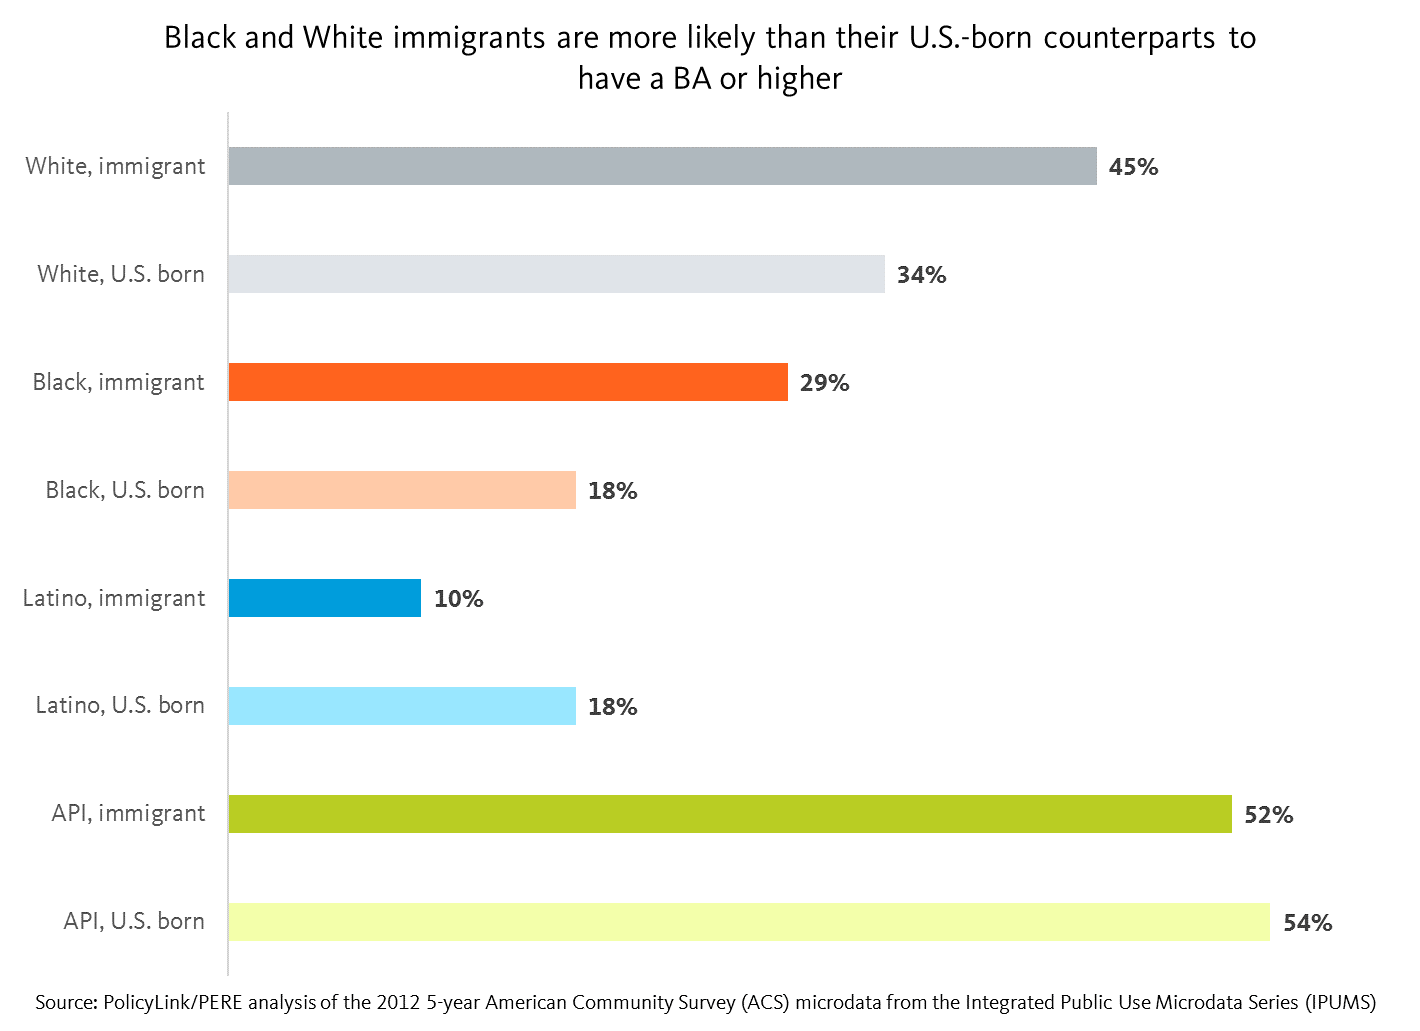
Black and White immigrants report higher levels of education than their U.S.-born counterparts
The new nativity cuts also allow for a within-group analysis that sheds light on how immigrants and U.S.-born people of the same race fare in comparison with one another.
For instance, using education as an example, we can see that higher rates of White and Black immigrants report having a BA or higher when compared with their U.S.-born counterparts. But the opposite is true for Latino and API immigrants: they are less likely than their U.S.-born counterparts to have a BA or higher.
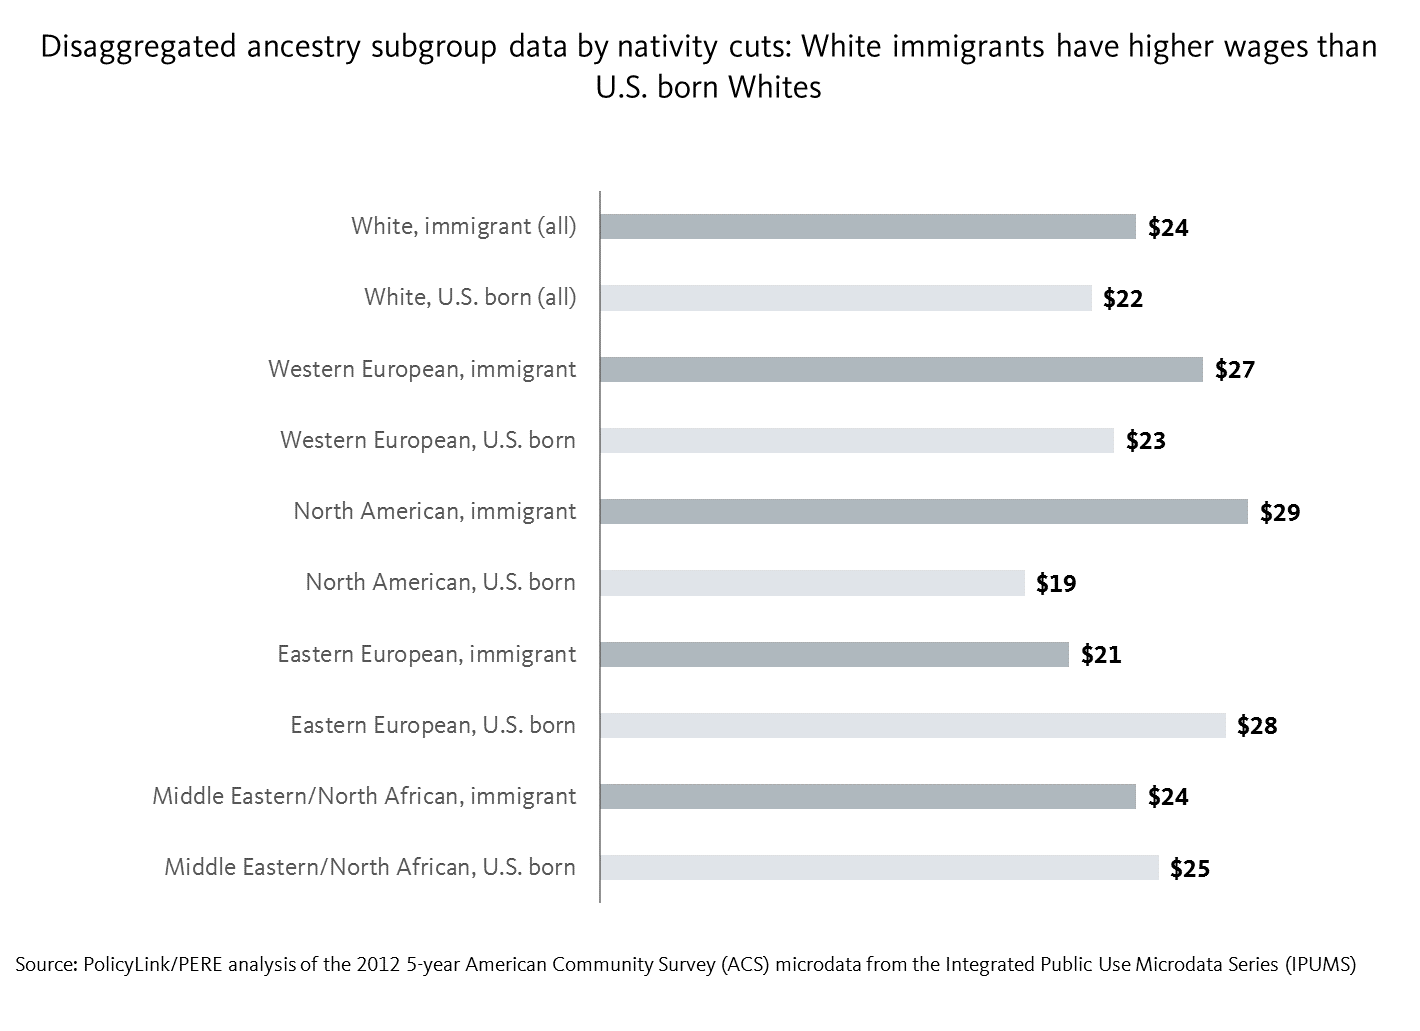
 We can do a deeper with-in group analysis by looking at the disaggregated ancestry subgroup data by the nativity cuts. For instance, using median wage as an example, immigrant Whites as a whole earn more than U.S. born Whites. Looking at the disaggregated ancestry subgroup data by nativity cuts reveals the following: immigrant Whites of Western European and North American ancestry reported lower median wages than their U.S. born counterparts, but immigrant Whites of Eastern European ancestry reported higher median wages than their U.S. born counterparts. On the other hand, immigrant and U.S. born Whites of Middle Eastern/North African ancestry reported the narrowest gap with respect to the disparity in their reported median wages.
 Studies show the significant economic contributions of Latino immigrants
In addition to the rich diversity and culture that immigrants bring to this country, studies show that immigrants continue to play a critical role in driving economic growth in their communities. According to a recent study by economists Dennis Coates and T.H. Gindling, “income growth that tends to accompany Latino population growth in rural counties is even greater where native-born, non-Hispanic populations have otherwise been shrinking”.
This study shows that immigrant spending in Nebraska generated up to $2.4 billion worth of output, in which the Latino immigrant community contributed up to $1.1 billion. There is a similar story in Iowa of Latino immigrant spending reaching up to $963 million of the estimated $2.5 to $3.2 billion in immigrant spending. Furthermore, the study found that the absence of Latino immigrants in the Omaha-Council Bluffs economy would lead to a 7.8 percent reduction in total production – an amount that translates to $6.5 billion.
Immigrant integration is an economic and moral imperative
Removing barriers to immigrant participation in the economy is key to a thriving and prosperous economy. The California Immigrant Policy Center, based in the state that is home to the largest population of immigrants, has policy priorities for 2016 ranging from access to health care to workers’ rights. Such advocacy efforts are crucial to ensure the socioeconomic inclusion of the immigrant community that has historically played an integral part in the making of a nation.
To access the data for your city, region, or state, go to nationalequityatlas.org, click on Indicators, and in the Equity menu, select one of the eight indicators listed above. On the indicator page, choose the “By nativity” breakdown to see the nativity cuts. Additionally, if you click on the “By ancestry” breakdown, a nativity filter appears below the graphic display that allows you to look at the data for U.S.-born people or immigrants.
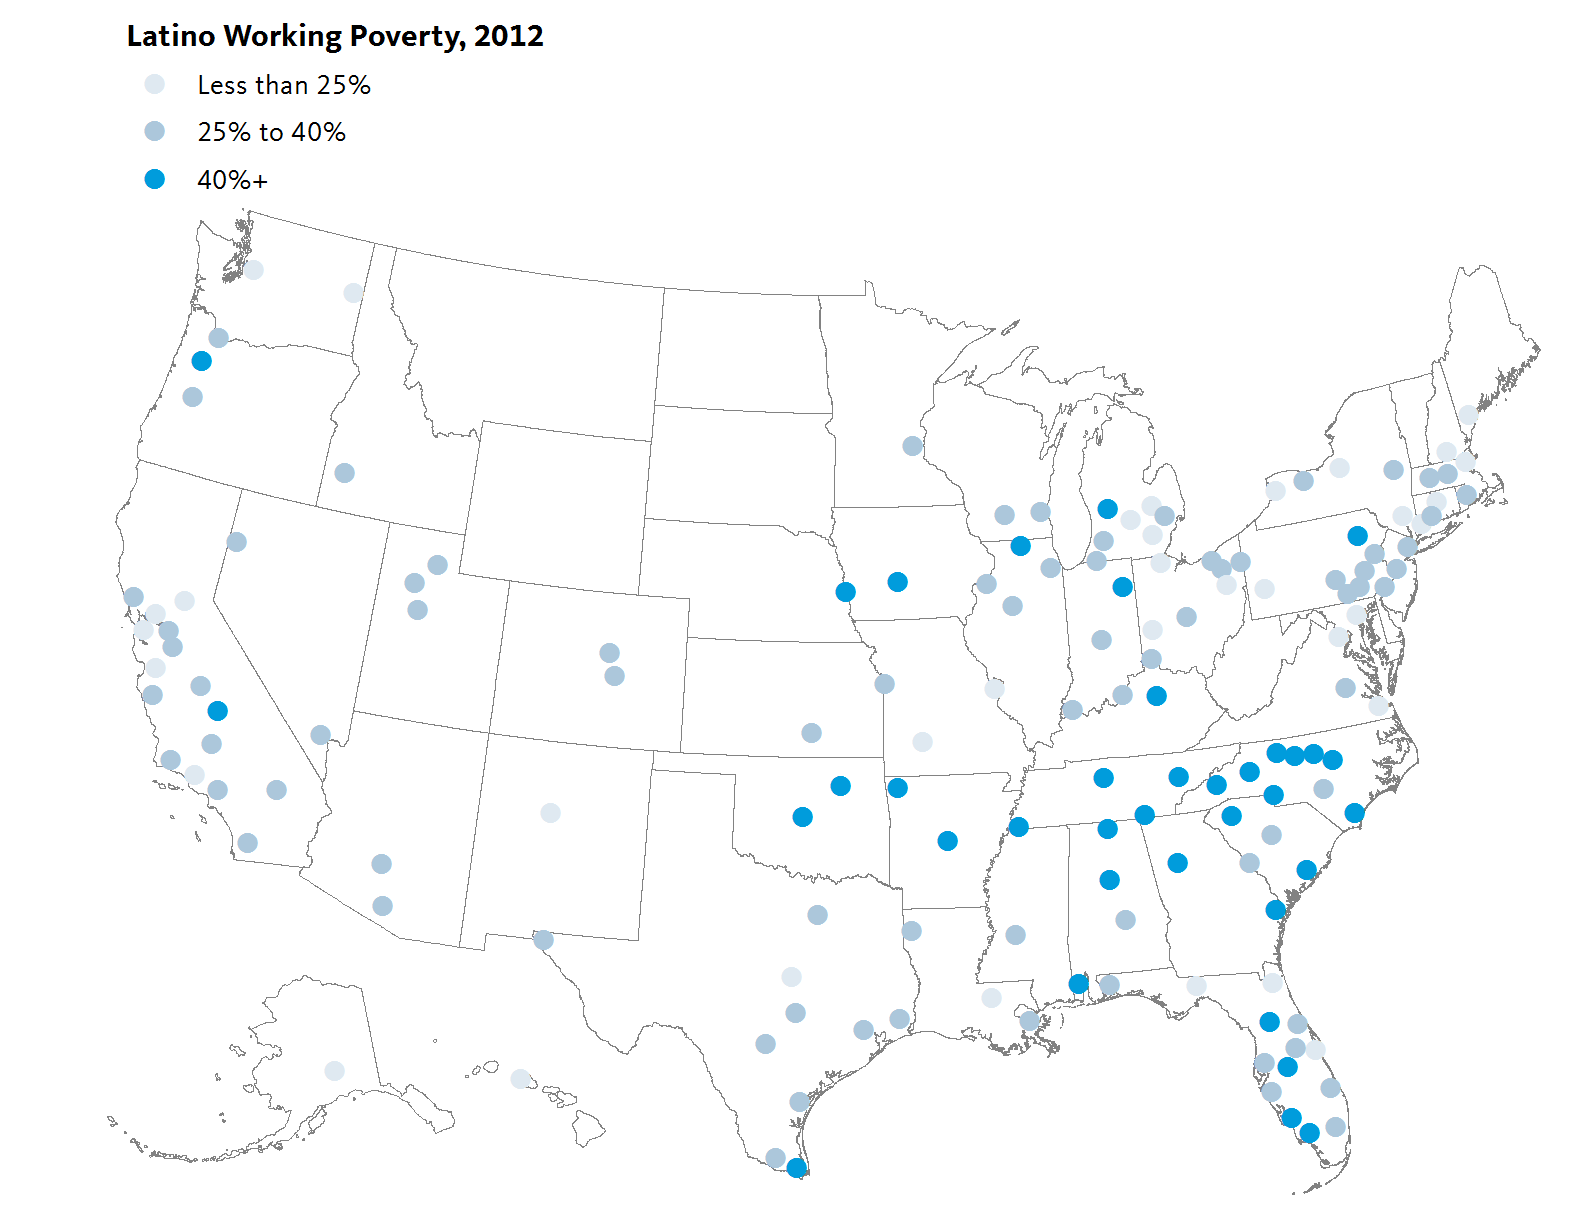
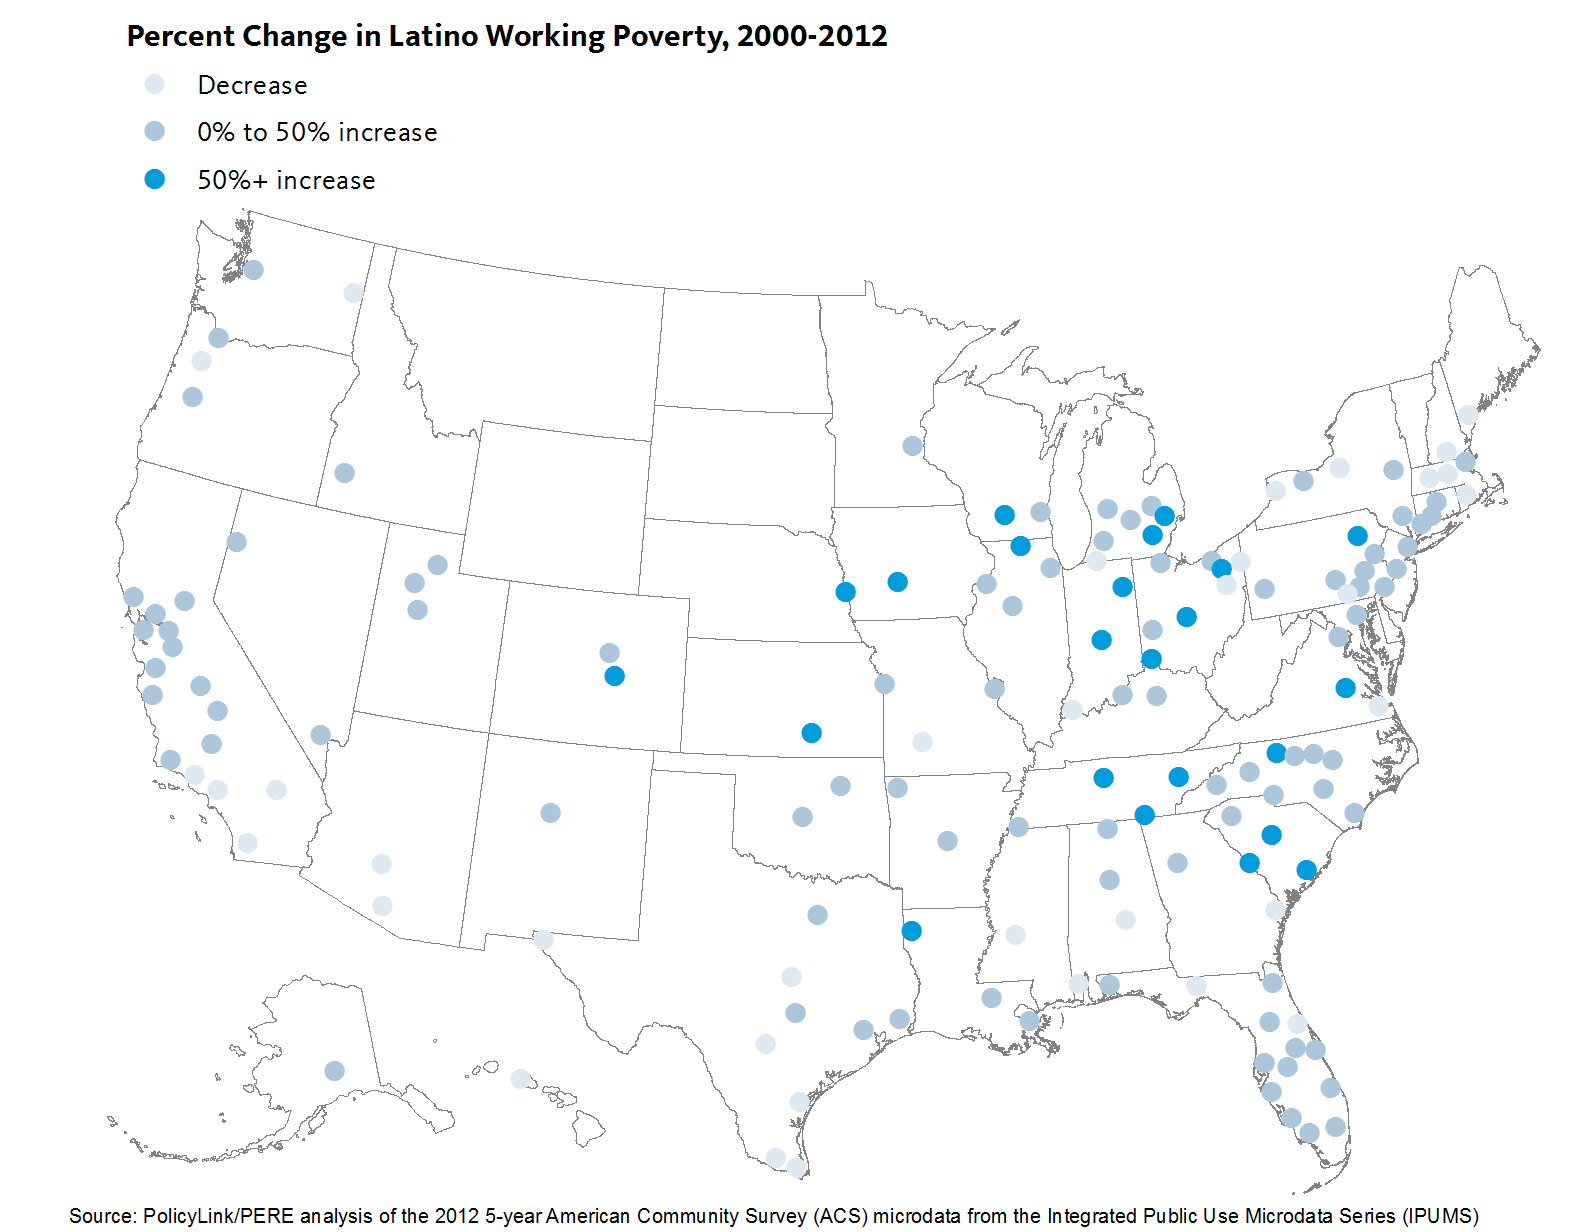
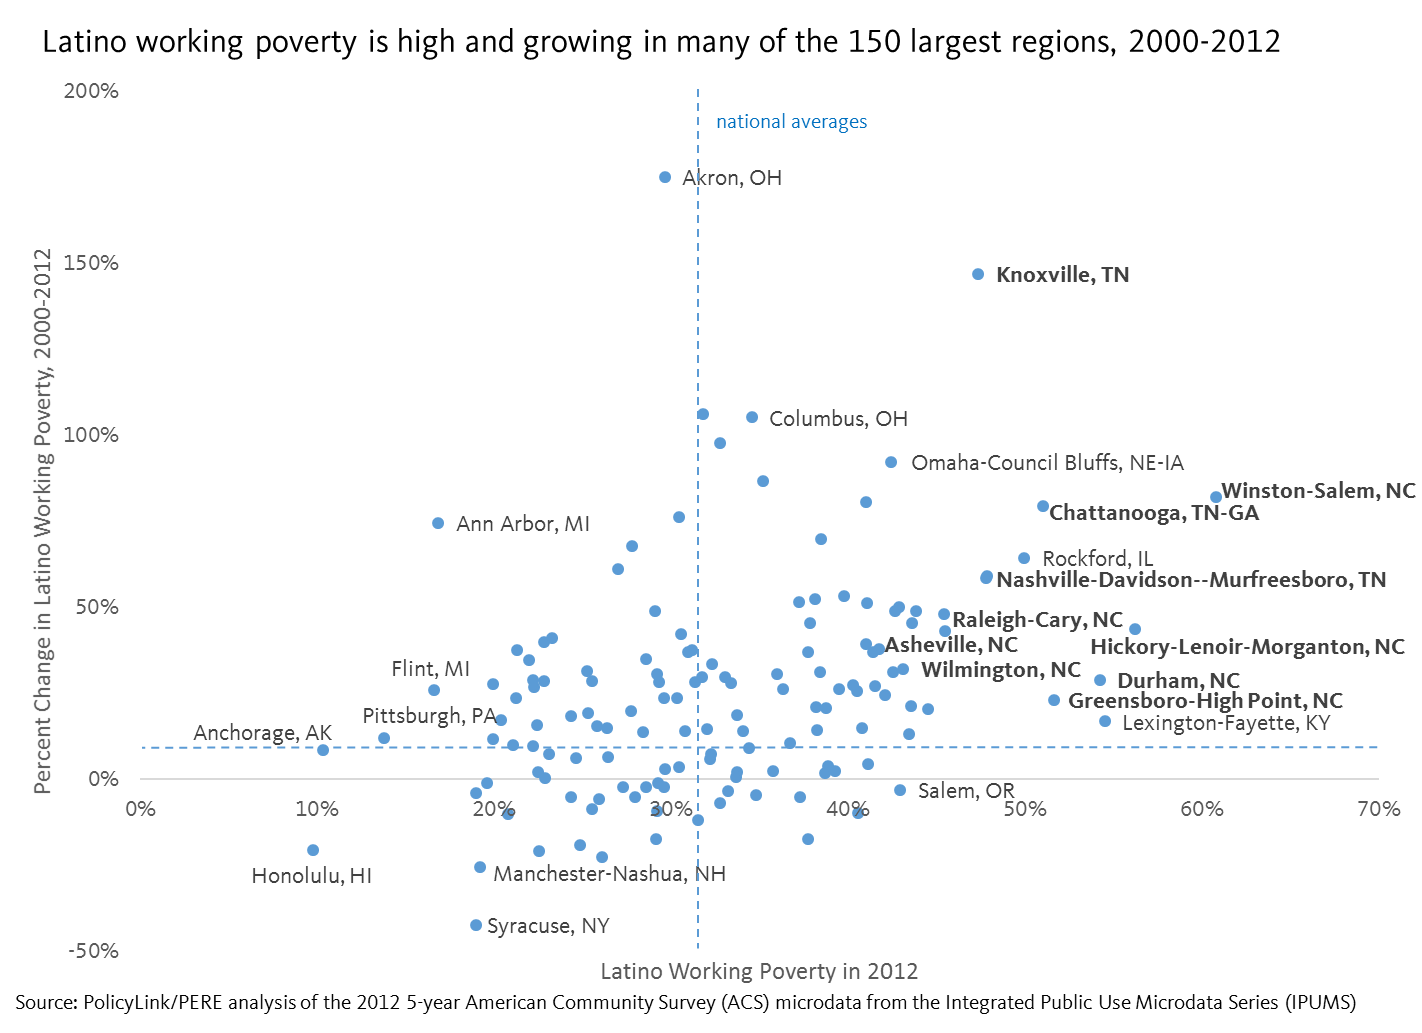 Regions in Tennessee and North Carolina have the highest rates of Latino working poverty