
Rent Debt in America
This dashboard was produced by the National Equity Atlas in partnership with the Right to the City Alliance to support strong renter protections for those impacted by the Covid-driven rent-debt crisis. It provides timely data on the number of households who owe back rent, the characteristics of those renters, the total debt they owe, and the allocation and distribution of renter relief funds.
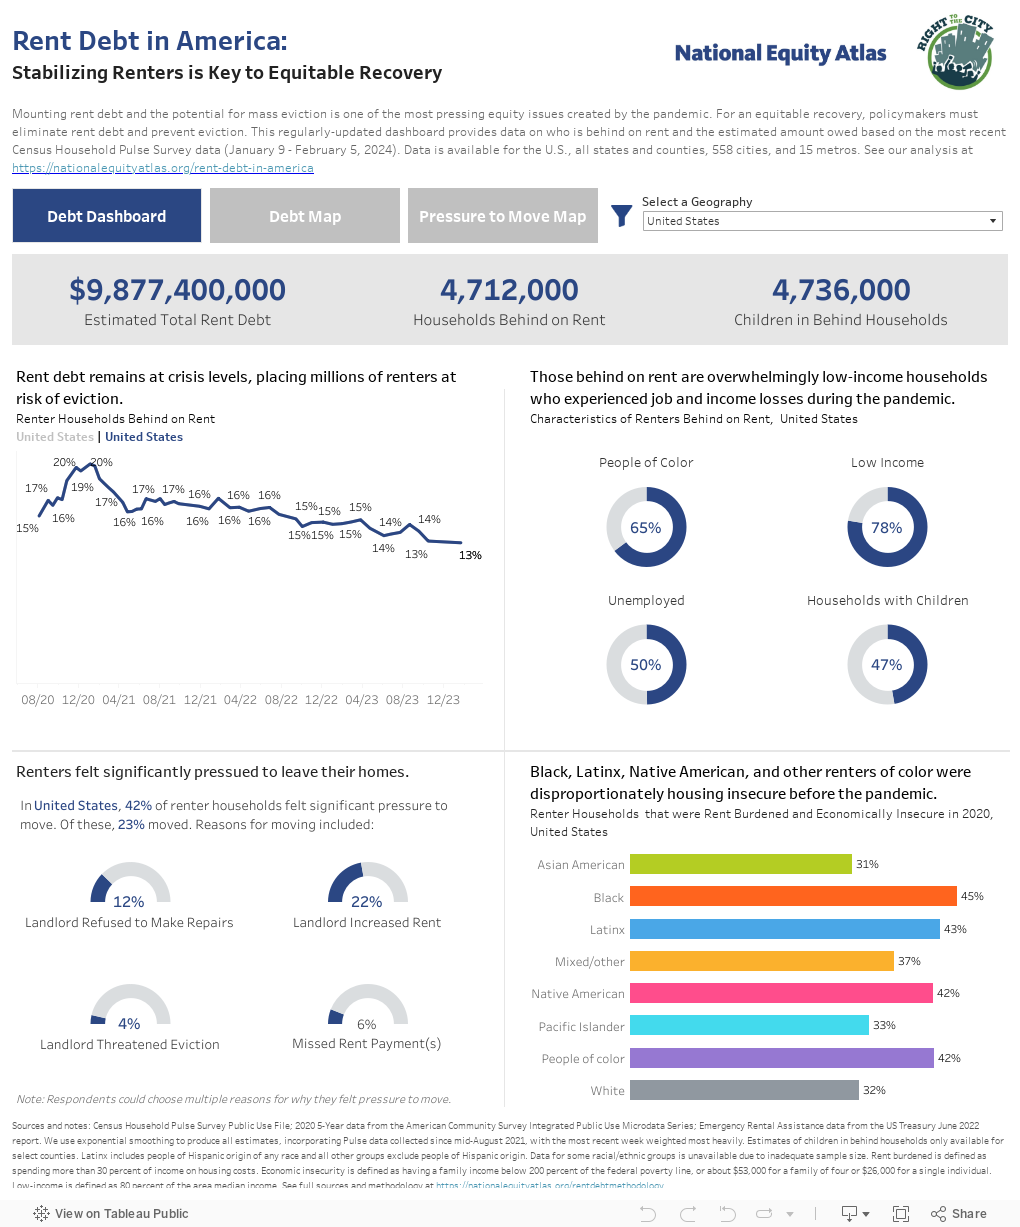
Key Takeaways
- The vast majority of renters who are in debt are low-wage workers, disproportionately people of color, who have suffered job and income losses due to the Covid-19 pandemic.
- While most places havae seen some improvement from a high of 19 percent in January 2021, the overall share of renters with debt has not declined since April.
- Nearly seven million children live in households that are behind on rent and therefore more vulnerable to eviction.
- Just 4 percent of those who owe back rent have received governmental rental assistance; nationally, just 11 percent of allocated aid has been distributed.
Drivers of Inequity
The rent debt crisis is primarily driven by the pandemic’s economic fallout. Low-wage workers, who are disproportionately workers of color, were hardest hit by Covid-related job losses and are most likely to suffer from rent debt. The pandemic exacerbated pre-existing housing insecurity for renters of color — especially women of color — who were already most likely to be rent burdened and at risk of eviction.
Equity Solutions
- Guarantee rent-debt forgiveness for all renters, regardless of immigration status, which should not be conditioned on landlords’ acceptance of funds or participation in programs.
- Provide financial assistance to landlords, with a focus on keeping small community-based landlords and nonprofit affordable housing operators solvent.
- Establish strong renter protections includinig eviction moratoria, rent freezes, and legal services for low-income renters.
Data Sources
The dashboard provides estimates of the amount of rent debt, the number of households with debt, the number of children living in those households, and average back rent owed for the US, states, counties, and select regions and cities. It also reports the amount of governmental aid allocated through the Emergency Rental Assistance Program (ERA 1). Drawing current data from the Census Bureau’s Household Pulse Survey, the US Department of the Treasury, and the University of Southern California Center for Economic and Social Research's Understanding Coronavirus in America survey, the dashboard data will be refreshed approximately every two weeks. Find our full methodology here.
Design Approach
The dashboard layout allows users to quickly see the data across four indiicators of rent debt in one view. The layout of the indicators follows the narrative regarding overall trends in rent debt burden and the characteristics of the households experiencing rent debt. The interactive map layer then provides an easy-to-read geographic comparison between counties in a given state.
Created By
Created by the National Equity Atlas in partnership with Chantilly Juggernauth of Lovelytics.