Prop 22 Pay Study Report: Methodology

By Justin Scoggins, Eliza McCullough, and Edward-Michael Muña
Data for this study was collected from 55 drivers from November 1, 2021, to December 12, 2021. For our analysis, we restricted our sample to only Uber and Lyft rideshare work and drivers during two-week periods for which we had sufficient data and that included at least 60 total work hours. This resulted in a sample of 21 drivers who generated 3,020 trips. We recruited drivers via direct advertisement to Rideshare Drivers United (RDU) membership. Drivers ran the Driver's Seat Cooperative (DSC) mobile app while working for two-week intervals and received $50 stipends for every two weeks of their participation.
The Driver’s Seat Cooperative mobile app is a tool that rideshare and on-demand delivery drivers use to track their work and then analyze their work data. The app empowers its users to collect and analyze detailed data about their work time, miles driven, and pay. Driver’s Seat Cooperative users can utilize their data to understand their true net earnings and track changes in their earnings over time. For this study, users opted-in to share their data with researchers at RDU and PolicyLink for further analysis. All study participants completed a separate survey that collected demographic information, their driving history, and details about their access to health insurance. The data collected via the app and demographic survey provided the basis for our analysis.
This document describes our methodology for estimating drivers' guaranteed minimum pay (or the effective wage floor) and current actual earnings under Proposition 22 and, in a hypothetical scenario, in the absence of Proposition 22 where driver guaranteed minimum pay and earnings are determined by California employment law.1 For all calculations, the intent is to estimate net earnings for rideshare work only under each scenario. The term net earnings refers to take-home earnings after payroll taxes and, in the Prop 22 scenarios, contributions necessary to enjoy the same benefits guaranteed to employees by California employment law. We also generated various estimates by including or excluding different sources of income and worker contributions toward health insurance as described below. Guaranteed minimum pay is defined as the minimum net pay a driver could possibly receive under each scenario (e.g., excluding tips and any other pay beyond guaranteed minimums) while the term actual earnings reflects drivers’ actual net earnings under each scenario (while holding driver reimbursements and benefits constant). We calculated pay at an individual driver level over two-week periods because rideshare companies calculate whether drivers are eligible for Proposition 22 pay adjustments every two weeks.
One challenge to the analysis is that under Proposition 22, most drivers use both apps (Uber and Lyft), and that is reflected in the data used for this study. We chose to generate estimates of net earnings under the California employment law scenarios using the data for both apps combined (as if each driver is working for only one app). While this approach does not fully make up for the lack of actual data on earnings under the hypothetical California employment law scenario, it does provide an estimate for actual earnings. The rideshare market is highly competitive, so we can expect that the wage estimate for both companies combined is similar to what we would estimate for a driver working for one company.
In the hypothetical California employment law scenarios, we also exclude overtime pay and bonuses (the term we use to refer to all bonuses, incentives, and reimbursements for canceled rides reported in our dataset). We base this exclusion on the assumption that rideshare companies may not allow drivers to work overtime and are also unlikely to offer bonus payments in a scenario in which they are required to pay drivers an hourly wage. Both methodological choices result in more conservative estimates of net earnings under the California employment law scenarios.
We faced another challenge when estimating accurate measures of time required for the analysis—total time (total work time, or app-on time), engaged time (the time from accepting a rideshare trip to drop-off), and wait time (total time minus engaged time). We organized our data into three datasets: 1) a trip dataset focused on trip-based earnings (pay, tips, and bonuses), trip request, start, and end times, and engaged miles, expressed at the worker/day/trip level; 2) a non-trip dataset, with earnings from canceled trips and those not associated with a particular trip (e.g., bonus and incentive payments), expressed at the worker/day/transaction level; and 3) a worker dataset with aggregated trip-based earnings, total time, total miles, and time and miles from pick-up to drop-off for all trips, expressed at the worker/day level. Note that the worker/day level refers to a day in which an individual driver recorded trips during the study period. Our initial dataset included 1,300 days in which driver participants recorded trips.
The challenge was two-fold: 1) the estimate of total time in the worker dataset originating from the DSC app, which was required to derive total time and wait time, often appeared unreasonably high or low in comparison to the sum of engaged time across all the trips for a worker in a given day; and 2) the estimate of total time was only available as a total for a worker on a given day and not assessed according to the particular app used (Uber, Uber Eats, Lyft, Grubhub, or DoorDash) or type of service (rideshare or delivery).
The first step we took to address the time estimation challenges was to focus only on rideshare work. From our initial dataset of 1,300 days of recorded trips, we dropped 57 days where drivers had conducted non-rideshare trips, which removed work for DoorDash or Grubhub from the analysis, and another 90 days where drivers had solely recorded Uber Eats trips. Knowing that we needed alignment between the trip and worker datasets for our analysis, we restricted our focus to the days found in both. As a result, we removed another 133 days from the dataset.
The next step was to drop cases where the total time measure was known to be inaccurate due to the driver not using the Driver’s Seat Cooperative app. A flag for this in the dataset led to us dropping another 501 days. We then cut 58 days where the reported mileage from pick-up to drop-off summed across trips was essentially equal to the total mileage reported for the day—implausible because there must be some mileage driven between drop-offs and pick-ups, and between home and the first pickup of the day.
Among the days where drivers recorded working that remained in the dataset, there were still several instances where the total time did not appear reasonable in comparison to the sum of engaged time across all the trips for a worker on a given day. In some cases, the two were equal or nearly equal (signaling that perhaps the driver turned on the DSC app late, after starting their shift), or the total time was unbelievably high (signaling that perhaps the driver forgot to turn the DSC app off at the end of the shift).
To adjust the total time (and the wait time) estimate for these circumstances, we assessed the trip dataset to develop an estimate of total time and wait time based entirely on the trip observations. Using the detailed time stamps of request time, pickup time, and drop-off time for each trip, we were able to directly compute the lag time between trips (time spent between the last drop-off and the next trip request). By sorting the dataset using the unique driver ID and trip start time, we observed the lag times between trips over the course of each worker’s shifts throughout the entire study period. Most were very short (under 15 minutes) and looked like true wait times between trips; some were much longer (six hours or more), appearing to be breaks between shifts; and some were in the middle (one to two hours), giving the impression of meals or other breaks taken during the shift.
When analyzing drivers’ daily lag time hours, it was clear that they tended to be shorter during the night shift (from 10 p.m. to 11 a.m.) and longer during the day shift (11 a.m. to 10 p.m.). We assumed that all lag times were true wait times if they were 30 minutes or less during the night shift, or 45 minutes or less during the day shift. We also assumed the lag times were actual breaks taken during the workday, or a lapse of time between shifts. This provided us with estimated wait times for most of each work shift, except for the wait time before accepting the first trip of each shift, and before the first trip after a break was taken. We then estimated these instances as being equal to the average of the initial estimates for a given day of recorded work (if they had at least one valid estimate), or the average of all initial estimates for the worker across the entire study period (if they did not have at least one valid estimate for a given day).
The estimated wait time was combined with engaged time to calculate the total time for each trip, and all three measures were summed to the worker/day level where we were able to compare our estimate of total time to that reported by the DSC app. That comparison is shown in Figure 1, where our estimate of total time (in minutes) based on the trip dataset is plotted on the vertical axis, and the total time reported by the DSC app is on the horizontal axis. As can be seen, for most of the days that drivers recorded their trips, the two measures are very similar. However, there are many observations spread across the right and bottom portion of the graph where the total time measured from the DSC app is substantially greater than the trip-based estimate.
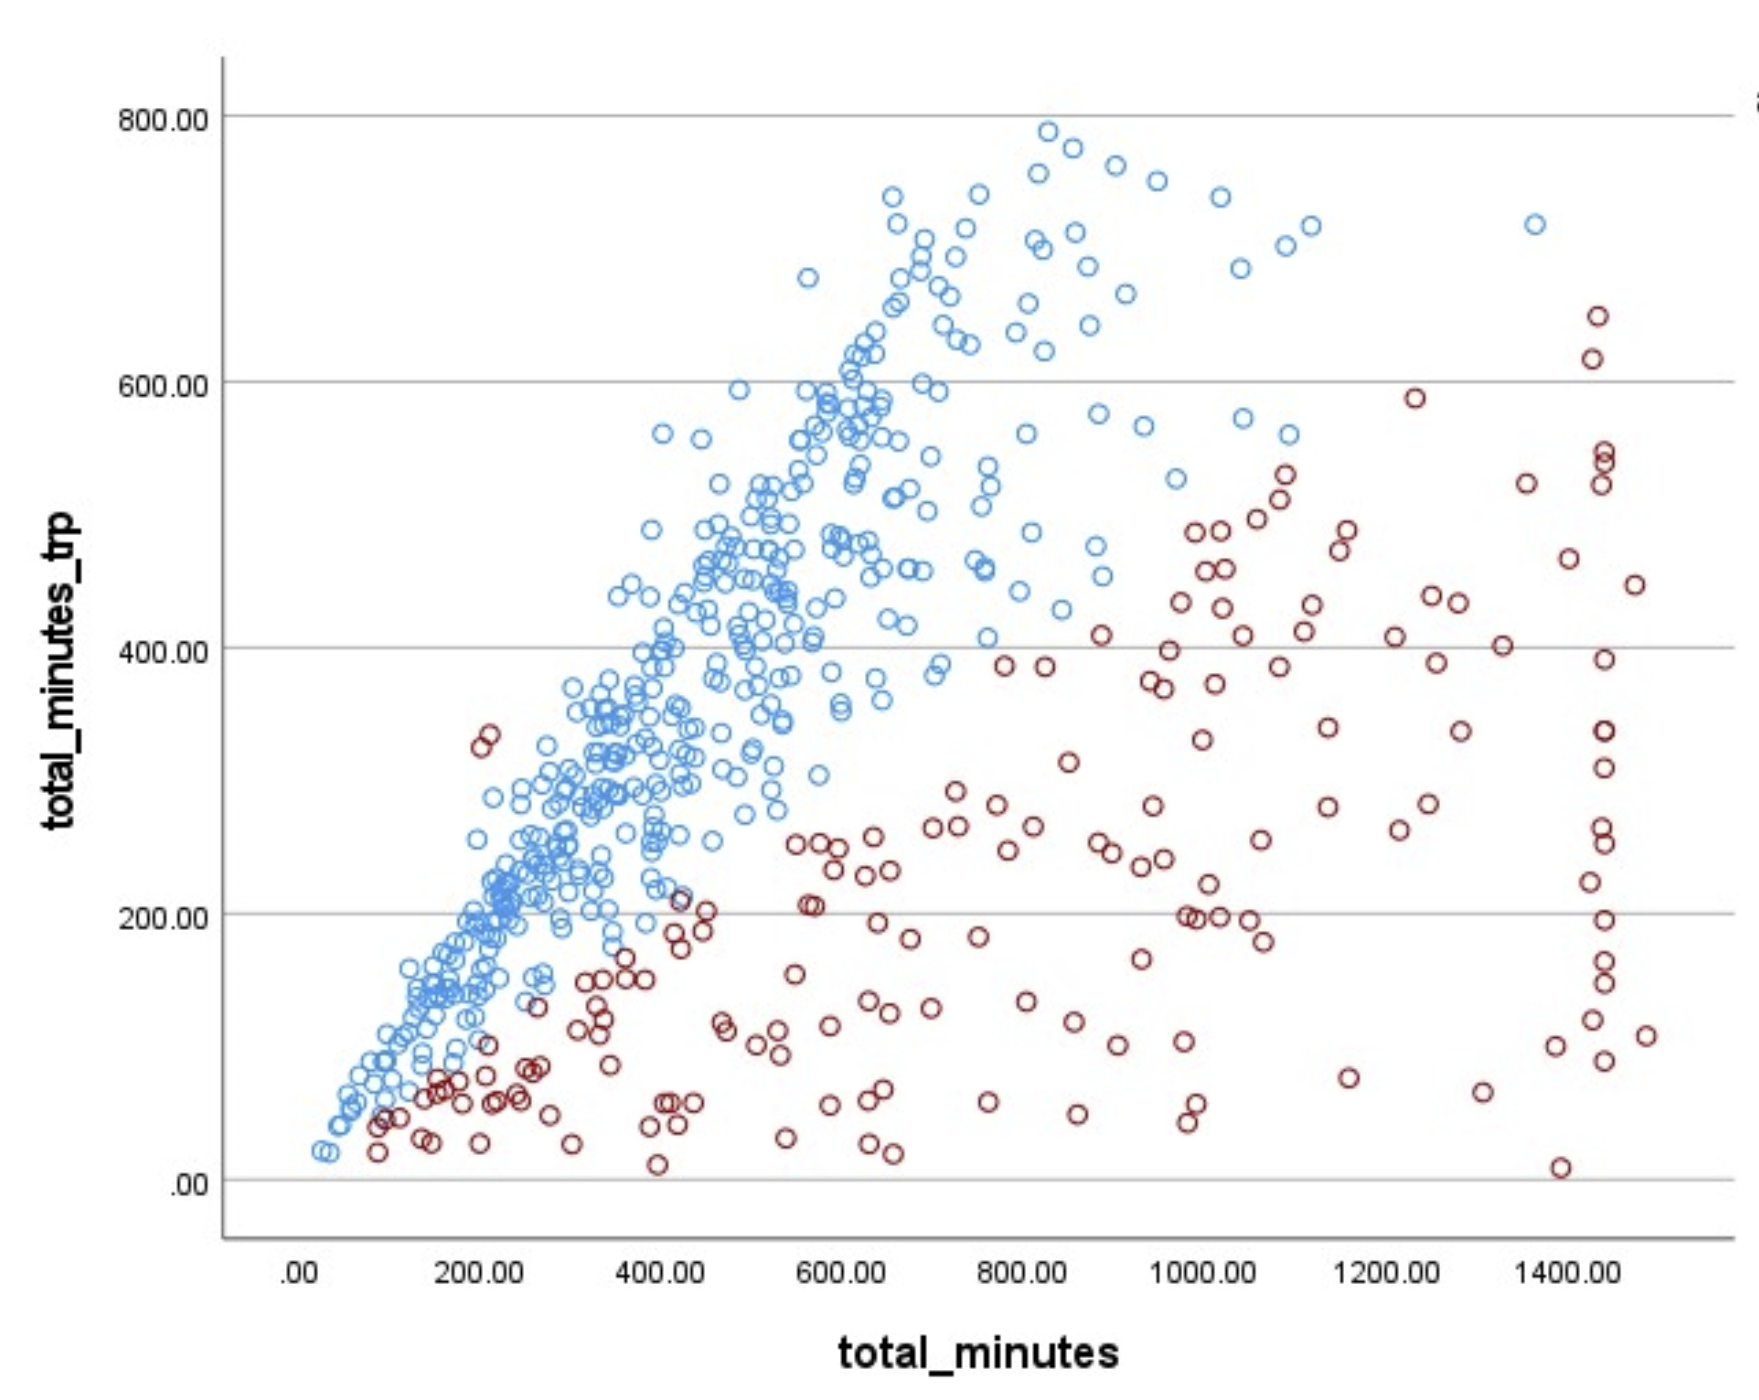
After testing a few different thresholds for substitution, we decided to use the total time measure (wait time) from the Driver’s Seat Cooperative app if the absolute percent difference between that time measure and our trip-based estimate equaled less than 50 percent of the trip-based estimate. If the absolute percent difference was 50 percent or more, we substituted our trip-based estimate of total time (wait time) as the final measure to use in our analysis. We adjusted the total (and wait) time values to match our trip-based estimate for 30 percent of the days of recorded drivers’ trips in the dataset used for our analysis. The observations that were adjusted are illustrated by the red circles in Figure 2. To eliminate any time spent on Uber Eats trips from our analysis, we adjusted our final total and wait time measures for days where drivers took Uber Eats trips by deflating them in proportion to the time spent on Uber Eats trips from our trip-based estimates.
Figure 1
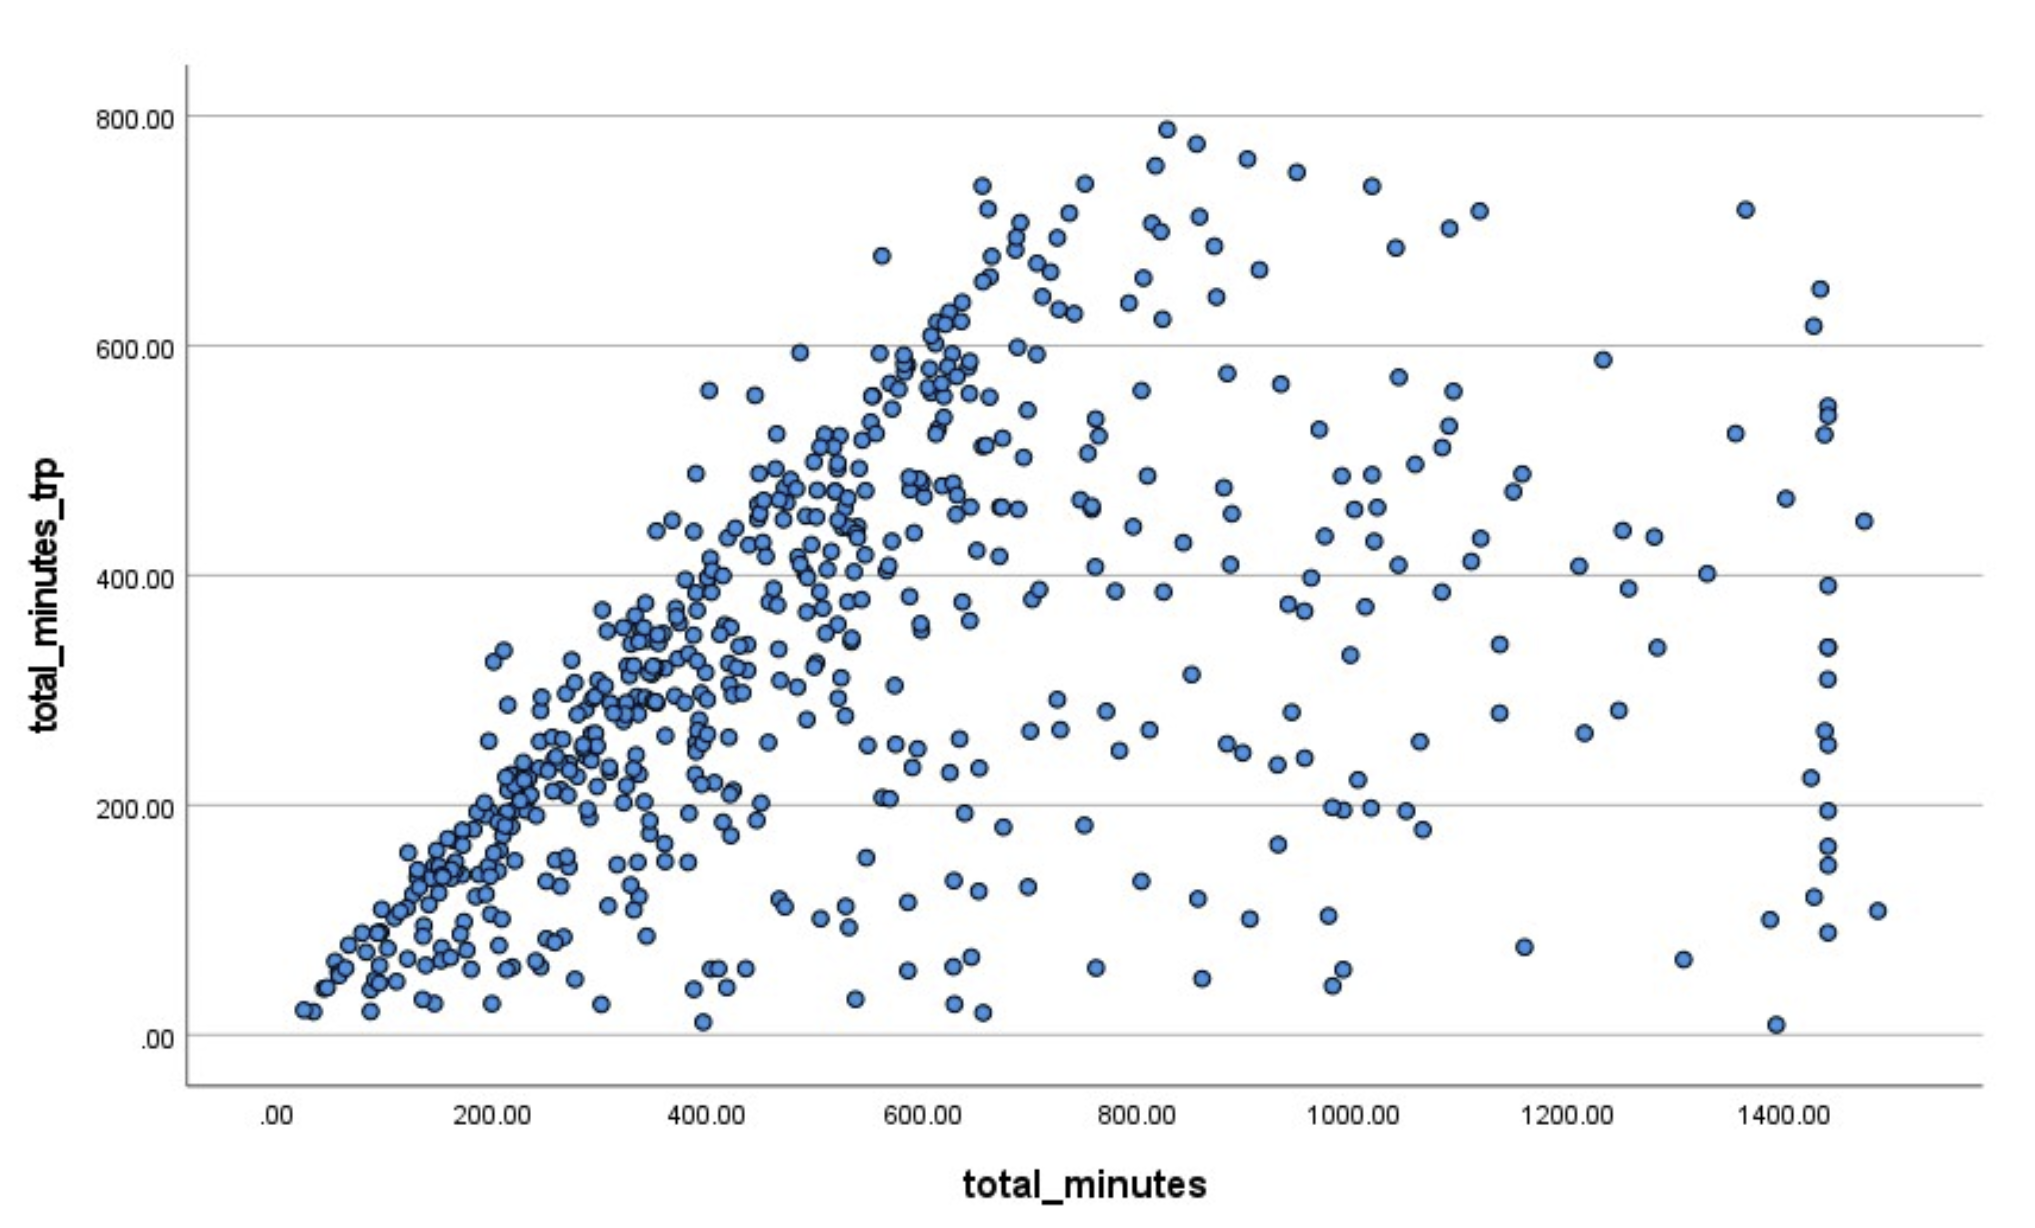
Figure 2
Driver guaranteed minimum pay and earnings under Proposition 22
Guaranteed minimum pay calculations
Under Proposition 22, rideshare companies must pay at least 120 percent of the minimum wage from where the passenger’s departure point is located at the time the driver accepts a ride, to the time they drop off the passenger, plus 30 cents per mile driven during that engaged time.2 To calculate this guaranteed minimum pay, we started with the hourly wage when an individual driver began their ride. We then multiplied drivers’ total engaged driving time for each two-week period by 120 percent of the minimum wage and added 30 cents for each engaged mile. While engaged driving time under Proposition 22 is defined as the time from accepting a ride to drop-off, due to data limitations we specified it as the time from when the request was made to drop-off. This has the effect of overstating engaged time but only very slightly, as most rides are accepted by a driver only moments after requests are made. Next, we subtracted the following costs for an independent contractor to receive net pay, and divided the result by the driver’s total app-on time engaged in rideshare work to determine hourly net pay as follows:
- Driving cost reimbursement: Under Proposition 22, drivers’ pay minimum is based in part on $0.30 per engaged mile, but this is only used to calculate minimum pay and it is not actually a reimbursement. To net costs associated with using one’s personal vehicle for work, we subtracted the 2021 IRS Driving Reimbursement rate of $0.56 per mile driven (engaged or unengaged).
- Social Security and Medicare: As independent contractors, drivers must pay a Self-Employment Tax to cover Social Security and Medicare. Independent contractors pay 15.3 percent of their net earnings into Social Security and Medicare taxes (self-employment taxes) compared to 7.65 percent for employees. To calculate this cost, we took total earnings, subtracted driving costs (these are not taxed), and multiplied the result by 15.3 percent.
- Unemployment insurance: As independent contractors, drivers do not receive unemployment insurance. To calculate the cost of lost unemployment insurance, we multiplied drivers’ total earnings by the unemployment insurance withholding rate, which is 3.4 percent for new businesses (which Uber and Lyft would be if Proposition 22 was no longer in place).
- Workers’ Compensation: As independent contractors, drivers do not receive workers’ compensation from their employer. However, Proposition 22 requires that rideshare companies provide occupational accident insurance to cover medical expenses of up to $1 million. The insurance also provides drivers with payments equal to 66 percent of their average weekly earnings for up to 104 weeks following the injury. This is weaker than workers’ compensation because it has a $1 million combined limit for lost work and medical expenses, it has no provision for permanent disability, and it does not cover vocational rehabilitation. To calculate the difference in value between workers’ compensation and the companies' occupational insurance program provided under Proposition 22, we assumed the occupational insurance program is worth half the value of workers' compensation. To calculate the value of workers’ compensation, we used the pure premium rate for taxicabs from the Workers’ Compensation Rating and Inspection Bureau. The September 2021 rate is $5.33 per $100 payroll, or 5.33 percent. We divided this by two, which equals 2.67 percent, and then multiplied by total earnings.
- California Employment Training: In California, employers contribute 0.1 percent of an employee’s income per year to the Employment Training Tax. Rideshare companies are not required to contribute to this fund when drivers are classified as independent contractors, as they are under Proposition 22. To calculate the cost of lost Employment Training benefits, we multiplied drivers’ total earnings by 0.1 percent.
- Paid Rest time: Under California employment law, employees receive a 10-minute paid break every four hours. As independent contractors, drivers do not receive paid rest time. To calculate the cost of lost paid rest time, we calculated the total app-on time (in hours), the rest break accrual rate (ten minutes for every 240 minutes of work), and gross hourly pay.
- Paid Sick time: In California, employees receive one hour of paid sick leave for every 30 hours worked. Because they are independent contractors, drivers do not receive paid sick time. To calculate the cost of lost paid sick time, we totaled the product of total app-on time, the sick time accrual rate of .03 (or one hour for every 30 hours worked), and gross hourly pay.
- Health Care: We chose to treat health care as a cost subtracted from drivers’ hourly earnings rather than as a benefit added to these earnings because we are attempting to capture drivers’ net earnings after paying for all expenses, including health insurance. Under Proposition 22, rideshare companies are required to pay a monthly stipend of 82 percent of the average monthly premium for a Covered California Bronze plan for drivers averaging more than 25 hours per week of engaged time. For drivers averaging at least 15 but less than 25 engaged hours in a quarter, companies are required to pay a stipend of 41 percent of the average premium. Drivers who work less than 15 hours of engaged time per week do not qualify for a stipend. In 2021, we completed a study that found drivers are most likely to receive their insurance through MediCal. We calculated wages for drivers for four health care scenarios, in which they either purchased insurance through Covered California at full price, purchased insurance through Covered California using a stipend equal to 82 percent of the average monthly premium for a Covered California Bronze plan, purchased insurance through Covered California using a stipend equal to 41 percent of the average monthly premium for a Covered California Bronze plan, or received MediCal as follows:
- Purchased at full price through Covered California: The average monthly premium for an individual Covered California Bronze Plan is $499. We calculated a biweekly cost by dividing $499 by 2.17, which is adjusted from 2 to reflect variance in the number of days worked per month. This results in an average biweekly cost of $230.31.
- Purchased through Covered California using an 82 percent stipend: We calculated the biweekly cost as 18 percent (one minus 0.82) of the full price through Covered California ($230.31), for a total of $41.46.
- Purchased through Covered California using a 41 percent stipend: We calculated the biweekly cost as 59 percent (one minus 0.41) of the full price through Covered California ($230.31), for a total of $135.88.
- Received MediCal: Drivers who receive MediCal do not have monthly premium costs.
Drivers’ actual earnings under Proposition 22
To calculate drivers’ actual net earnings, we summed all app-recorded earnings for an individual driver’s rideshare work over each two-week period, including bonuses and tips. For any two-week period in which the Proposition 22 minimum pay was higher than gross earnings (excluding tips), the Proposition 22 minimum was substituted for those gross earnings. We then subtracted the same costs outlined above and divided the result by the total app-on time doing rideshare work to determine a net hourly wage.
Driver guaranteed minimum pay and earnings as defined by California employment law
To estimate drivers’ hourly wage if they were classified as employees and subject to California employment law, we combined Uber and Lyft earnings. We chose this method because 1) most drivers work for both companies simultaneously (using both apps simultaneously); and 2) we anticipate that if drivers were classified as employees, they would likely drive for one company or the other, rather than splitting their time and thereby potentially foregoing overtime pay (assuming that the rideshare companies allowed for this option). Given that the rideshare market is highly competitive, we can expect that the wage we estimated for both companies combined is similar to what we would estimate for a driver working for one company. This method calculates overtime pay using the total app-on time (including time spent driving for both Uber and Lyft).
Guaranteed minimum pay calculations if classified as employees
If drivers were classified as employees, they would be guaranteed a minimum wage for total time worked plus overtime pay. However, as noted above, our methodology assumes no overtime pay. To calculate guaranteed minimum pay using combined Uber and Lyft data, we used the minimum wage for the locality where the driver was driving and multiplied it by their total app-on time. We then subtracted the following costs from this figure and divided it by total app-on time doing rideshare work to determine their hourly net pay:
- Health Care: Companies are required to provide health insurance for all employees working more than 30 app-on hours per week. If drivers averaged more than 30 app-on hours per week over a two week pay period, we calculated the cost of employer-sponsored health insurance to drivers. We used the average annual employee contribution to employer-sponsored health insurance ($1,242) and converted this to a biweekly figure of $47.77.
- Social Security and Medicare: As employees, drivers would be responsible for putting 7.65 percent of their earnings into Social Security and Medicare taxes, or payroll taxes. To calculate this cost, we multiplied gross earnings including overtime by .0765.
Drivers’ potential earnings if classified as employees
To calculate this potential wage, we used the total guaranteed minimum pay calculation if classified as employees from the combined Uber/Lyft data scenario and added tips. We then divided by the total app-on time doing rideshare work to determine drivers’ hourly net earnings.
Acknowledgments
The authors thank Ken Jacobs and Michael Reich of the UC Berkeley Center for Labor Research and Education for their work and guidance, which were foundational in the development of this methodology.
Notes
1 Note that we refer to the minimum pay guaranteed to drivers under Prop 22 as the “effective wage floor” in the report to reflect how this minimum is not fixed because it fluctuates with consumer demand. In this document, we refer to it as the “guaranteed minimum pay.”
2 Drivers are not paid during wait times when apps are on before accepting rides. If drivers’ total daily fares are more than this amount, they are not paid additional income.