Median Wages
In an equitable economy, all workers would earn a living wage, without systematic differences by race and gender. Low wages and pay gaps by race and gender undermine workers and their communities, while reducing local spending and tax revenue. Ensuring pay equity and rising wages for low-wage workers will boost incomes, resulting in more of the consumer spending that supports business growth and job creation. The Median Wages indicator measures median hourly wage for full-time wage and salary workers ages 25-64.
Step 1: Go to the Median Wages Starter Workbook page in Tableau Public.
Step 2: Download the workbook and open in the Tableau Public App. Instructions on downloading the Tableau Public App can be found on our Using Tableau page.
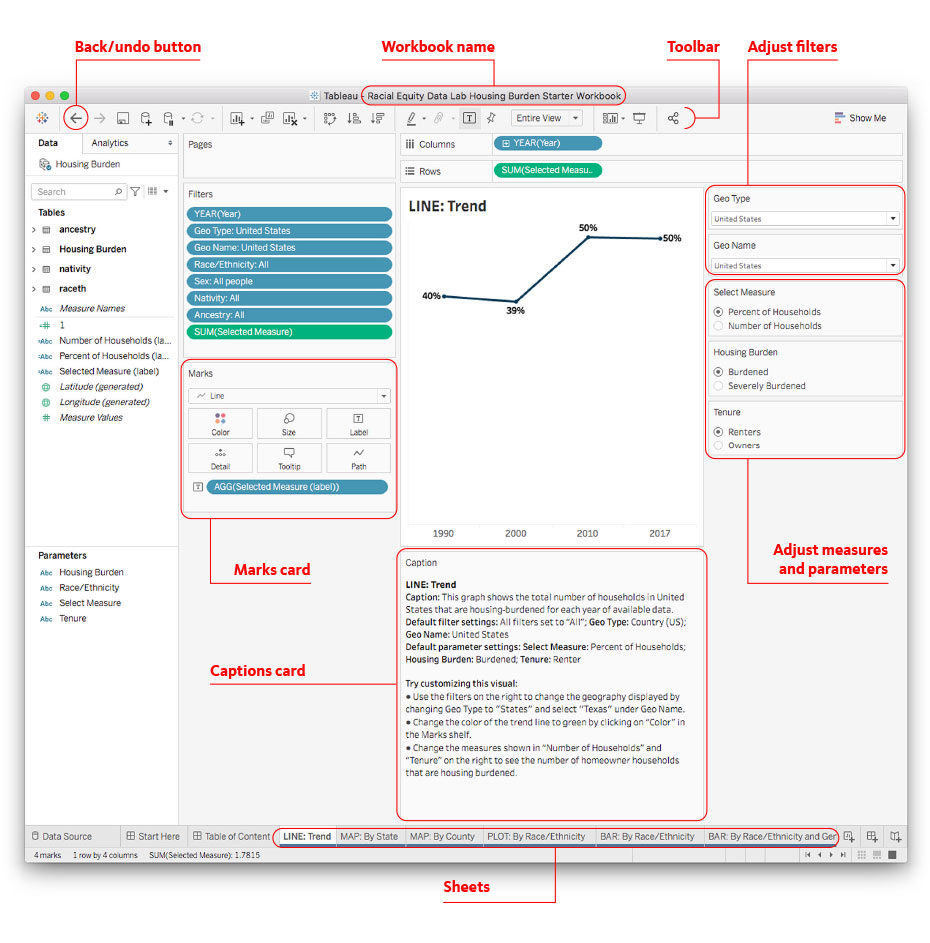
Components of a Tableau workbook

- Use the instructions on the Start Here sheet for more information about the workbook features.
- The Table of Contents sheet lists all the example charts available in the starter workbook.
- The Caption card below each data chart type provides instructions for understanding the data as well as some suggested customization options.
- Use the Filters on the right side of the Tableau workbook for each sheet to adjust Measures and Parameters.
- Adjust colors in the Marks card.
- If at any time you want to un-do a step, use the back button in the top left corner of the workbook screen, or refer to the default settings in the Caption card to reset the chart.
- Follow the steps on the Publish sheet to export and download your visualizations.
To learn more about the Tableau workspace and icons, click here.