Working Poor
All jobs should pay living wages. Far too many full-time jobs do not pay enough to keep workers out of poverty, leaving them struggling to pay their bills, leastwise invest in their future. Low-wage workers face the challenge of finding affordable childcare and experience greater family instability and worse health than higher-wage workers. The percentage of all workers ages 25-64 who are "working poor," defined as both (1) working full-time and (2) having a family income below the indicated federal poverty threshold based on family size and composition. The three different definitions of "poor" are based on ratios of family income to the federal poverty level (below 100, 150, and 200 percent).
Step 1: Go to the Working Poor Starter Workbook page in Tableau Public.
Step 2: Download the workbook and open in the Tableau Public App. Instructions on downloading the Tableau Public App can be found on our Using Tableau page.
Tableau Workbook Layout
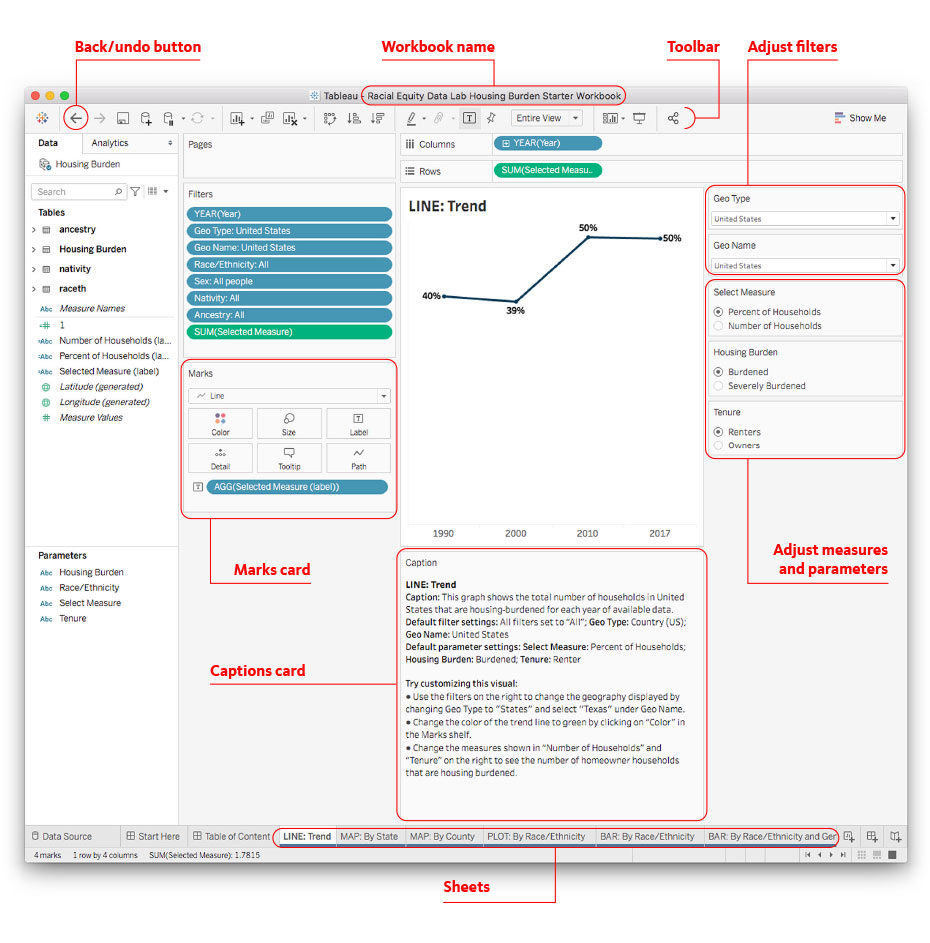
- Use the instructions on the Start Here sheet for more information about the workbook features.
- The Table of Contents sheet lists all the example charts available in the starter workbook.
- The Caption card below each data chart type provides instructions for understanding the data as well as some suggested customization options.
- Use the Filters on the right side of the Tableau workbook for each sheet to adjust Measures and Parameters.
- Adjust colors in the Marks card.
- If at any time you want to un-do a step, use the back button in the top left corner of the workbook screen, or refer to the default settings in the Caption card to reset the chart.
- Follow the steps on the Publish sheet to export and download your visualizations.
To learn more about the Tableau workspace and icons, click here.