Chart of the Week: Mayor De Blasio’s New Specialized High School Admission Policy is a Step Toward Educational Equity
To add equity data to the national dialogue about inclusive economies, the National Equity Atlas team regularly shares charts produced with data from the Atlas related to current events and issues. Join the conversation on social media using #equitydata.
Earlier this month, New York City Mayor Bill de Blasio announced a plan to phase out the Specialized High Schools Admissions Test in an effort to increase access to the city’s highest performing public high schools for low-income students who are disproportionately underrepresented students of color. Instead of the high-stakes standardized test, where test preparation is not offered in public elementary or middle schools, students will be admitted based on their academic achievements. The proposal addresses persistent racial disparities: Latinx and Black students make up 70 percent of the city’s public-school population, but only 10 percent of students at the eight specialized high schools. The administration expects that after the policy is fully enacted, admission offers to Latinx and Black students will increase from 9 percent to 45 percent of total offers.
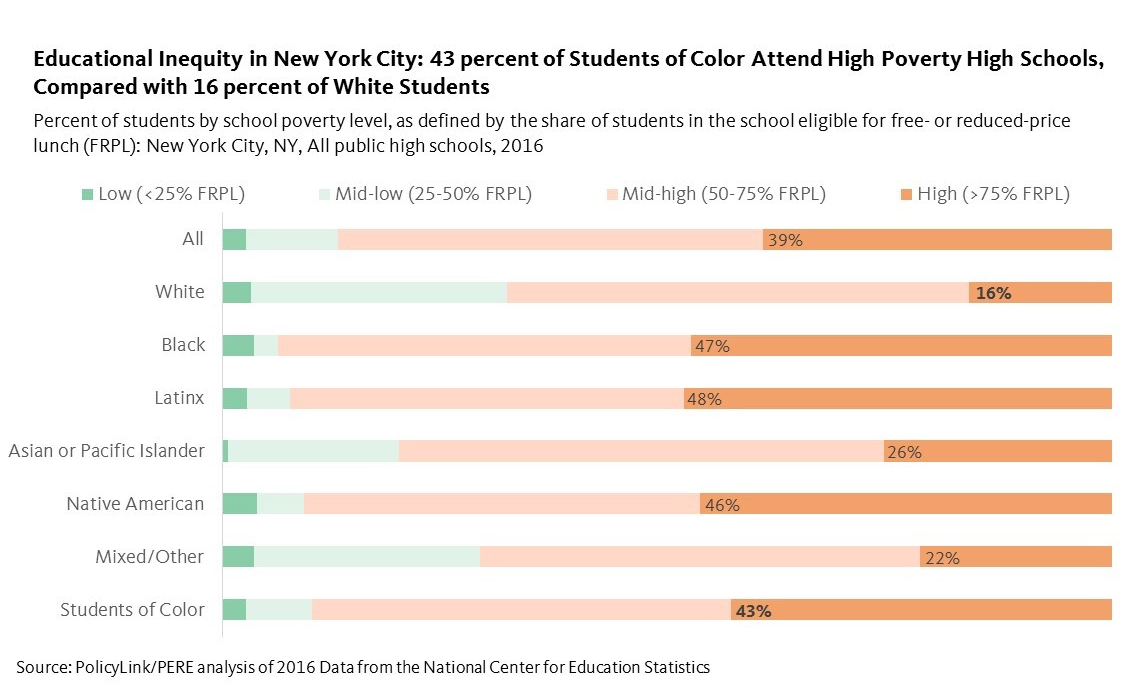
But with more than 400 high schools in the district serving over 240,000 students, increasing accessibility to these elite high schools is only the first step toward achieving an equitable public-school system. This week’s chart highlights the pervasive racial and economic segregation of public high schools in New York City, using the percentage of students who qualify for the free and reduced-price school lunch program as a measure of “school poverty.”
Research indicates that students who attend high poverty schools, regardless of family socioeconomic status, fare worse than students attending low poverty schools. In New York City, nearly half of Latinx, Black, and Native American high school students attend high poverty schools where more than 75 percent of students are low-income, compared with just 16 percent of White students. Students of color in New York City, overall, are nearly three times as likely as their White counterparts to attend a high poverty high school.
Three quarters of New York City’s youth are people of color: for the city to thrive, these youth must be able to access a high-quality education that prepares them for college and the workforce. Yet they are disproportionately stuck in segregated, inadequately funded schools. To build a strong workforce for the future, and deliver on the promise of education for all, New York City should adopt strong policies to ensure equitable school funding, prioritize training, hiring, and retaining highly qualified teachers for hard-to-staff schools, and implement local measures to increase school integration. The city can take its cue from California, where implementation of an equitable school funding policy in 2013 has led to improvements in graduation rates and academic achievement for Latinx, Black, and low-income students.
To see how school poverty varies in your community in addition to solutions and strategies, visit the National Equity Atlas and type in your city or state.