Just Released: New California Eviction Data and Five Regional Blueprints for Workforce Equity

Dear Atlas Users,

Happy 2021 from the National Equity Atlas team! While this new year brings changes in federal and local administrations, the devastating impacts of Covid-19 continue, particularly for communities of color. The Atlas team remains focused on leveraging our data capacity to support the movement for racial and economic equity—producing unique analyses, building partnerships, and sharing our work with the field to strengthen local organizing and policy efforts. Here are some updates:

Five Regional Reports Highlight Workforce Inequities and Strategies for an Equitable Recovery

As our nation faces overlapping and interconnected public health and economic crises, now is a critical time to move beyond a narrow skills-driven approach to workforce development and dismantle the structural and systemic barriers that lead to deep racial inequities in the labor market. This week, we released five new reports that will catalyze action on workforce equity in Boston (with SkillWorks), Chicago (with the Chicagoland Workforce Funder Alliance), Dallas (with Pathways to Work), the San Francisco Bay Area (with ReWork the Bay), and Seattle (with the Workforce Development Council of Seattle-King County). These reports are part of the Advancing Workforce Equity project, a partnership between the National Equity Atlas, Burning Glass Technologies, the National Fund for Workforce Solutions, and with support from JPMorgan Chase.

On January 26, the National Fund for Workforce Solutions hosted a virtual launch event which featured local leaders from each community as well as Angela Glover Blackwell (PolicyLink), Amanda Cage (National Fund for Workforce Solutions), and Monique Baptiste (JPMorgan Chase & Co).

Atlas Team Finds Over One Million Californians are Behind on Rent

In partnership with Housing NOW! California, we produced a fact sheet that sheds new light on the magnitude of the rent debt challenge in California and its potential impacts on racial equity, household finances, and public health. Based on the latest Census Household Pulse Survey data, 1.1 million renter households in California—one in five—are currently behind on their rent. We estimate that the average rent debt per household is $3,400 and the total rent debt in California is about $3.7 billion. The vast majority of those behind rent are low-wage workers of color disproportionately impacted by the pandemic, revealing how clearing this debt is critical to prevent the growth of the racial wealth gap and make an equitable recovery possible. Our findings were covered by news stations including NBC Bay AreaKRON4CBS Local, and KION 546.

Analysis Reveals Large Disparities in Unemployment Filings by Race and Education

Using data from California Policy Lab, our recent analysis highlights how California’s Black workers are experiencing disproportionate unemployment in the Covid recession due to structural racism embedded in the labor market. About 85 percent of California’s Black workforce has filed for unemployment at some point since March 15, which is more than double the rate for White, Latinx, and Asian or Pacific Islander workers. Virtually all Black workers with no post-secondary education (99 percent) have filed for unemployment insurance since March. Immediate policy changes, from expanded unemployment insurance benefits to building worker power, is required to overcome these dramatic disparities driven by racism embedded in our labor markets and education system. Read the analysis here.

- The National Equity Atlas team at PolicyLink and the USC Equity Research Institute (ERI)

Tackling Structural Racism Key to an Equitable Recovery in California

Data on unemployment filings in California reveals how the Black working class has been hardest hit by the Covid recession, underscoring the need for targeted, race-conscious recovery strategies. 

By Eliza McCullough

While the economic crisis has affected a startling number of workers, workers of color and low-wage workers have been hit the hardest. In California, 8.7 million workers (nearly 45 percent of the labor force) have filed for unemployment insurance (UI) since the start of the pandemic in March 2020. But job displacement has varied dramatically by race and education, as illustrated by the  California Policy Lab’s recent analysis of UI claims data. This post highlights how California’s Black workers are experiencing disproportionate unemployment in the Covid recession due to structural racism embedded in the labor market, and describes policy priorities to ensure an equitable recovery.

About 85 percent of California’s Black workforce has filed for unemployment at some point since March 15th, which is more than double the rate for White, Latinx, and Asian or Pacific Islander workers. This includes workers who filed for either regular UI or Pandemic Unemployment Assistance (PUA), a program created by the CARES Act to extend benefits to workers not usually eligible for regular UI.* 

This unemployment crisis for Black workers in a time of economic contraction threatens to increase already-wide racial inequities in employment. Structural racism embedded in the US labor market has created barriers to employment for Black workers that predate the current recession, ranging from employer bias and discrimination to residential segregation and mass incarceration. Black workers are typically the group hardest hit by economic downturns and are often the last to recover, as evidenced during the Great Recession when Black workers disproportionately suffered from long-term unemployment. The current economic crisis has most negatively impacted the hospitality, retail, and tourism sectors, industries in which Black workers are concentrated due in large part to discriminatory public policies that restricted Black workers’ access to better-paying jobs in other industries (a phenomenon known as “occupational segregation”). As these service sectors have gone through massive lay-offs, Black employees have been subject to the “last hired, first fired” phenomenon in which low-wage positions are the first to be eliminated.

Further disaggregating the data by race and educational attainment, we see that racial inequities are particularly extreme among workers without four-year degrees. Workers of all races with lower education levels have been hardest hit by the Covid recession: More than half of California workers with a high school degree or less (who account for 38 percent of all workers in the state) have filed for unemployment since March 2020 compared to 13 percent of workers with a Bachelor’s degree or higher. But unemployment filings are particularly high for Black workers without post-secondary education: virtually all Black workers with a high school degree or less (99 percent) have filed for unemployment, along with 75 percent of Asian or Pacific Islander workers with this level of education, compared with 52 percent of White workers and 33 percent of Latinx workers.

Black workers are overrepresented in lower education groups due to deep-seated structures of racial exclusion which have created significant barriers to accessing higher education. Residential segregation, perpetuated by exclusionary zoning, has led to the concentration of low-income Black children in schools with inadequate resources, which researchers have found is the key driver of the educational achievement gap. Along with the rising costs of college, these barriers prevent many Black students from accessing post-secondary education. As middle-wage jobs have shrunk in recent decades, Black workers with no higher education have been pushed into low-wage, ‘flexible’ positions with minimal protections. These jobs have been most impacted by wage cuts, diminished hours, and layoffs during the current economic crisis. 

Toward an Equitable Economic Recovery

Black workers and other workers of color are in dire need of increased supports in California and nationwide. Policymakers and business leaders must take action to address immediate economic needs as we enter the eleventh month of the pandemic. At the same time, they must launch forward-thinking, race-conscious strategies that lay the foundation for an equitable recovery and future economy. We recommend the following:

  1. Continue expanded UI benefits and provide direct cash support. Additional UI payments under the Federal Pandemic Unemployment Compensation program should be increased back to $600/week (as provided from March to July). Additional and ongoing direct payments, such as the one-time $1,200 payments included in the CARES Act, could also provide a lifeline to unemployed workers and Black workers who are less likely to have adequate savings to fall back on.

  2. Prevent evictions and foreclosures and provide debt relief to Covid-impacted households. As unemployed workers are more likely to be behind on rent and California’s Black renters are already paying unaffordable rent, policymakers must extend eviction moratoriums and provide rent debt relief. Limited rental assistance funds should be targeted to the hardest-hit households, particularly those in predominantly Black neighborhoods and neighborhoods of color, to prevent displacement and homelessness.  

  3. Protect existing jobs. Multiple cities have passed legislation to ensure that laid-off workers in low-wage sectors can return to their former jobs. For example, Oakland’s Right to Recall policy requires employers in hospitality and travel to give laid-off workers priority when operations resume. Similar policies that protect jobs across sectors should also be implemented at the state and federal levels to ensure low-wage workers do not suffer from long-term joblessness or decreases in income and benefits. 

  4. Build worker power. Unions have been shown to reduce racial inequality and provide economic security for Black workers. California policymakers must repeal Prop 22, which misclassifies app-based drivers as independent contractors and prevents their access to basic labor protections. Legislation that empowers workers, such as AB3075 which holds employers more accountable for wage theft, should be strengthened and expanded to ensure that recessions are less catastrophic for low-wage workers. Finally, California must increase funding for enforcement of labor and employment laws while also making state financial support for businesses conditional based on compliance with those laws.

  5. Create high-quality public jobs accessible to unemployed workers. A Federal Job Guarantee would ensure everyone has access to living-wage jobs while meeting the physical and care infrastructure needs of disinvested communities. Policymakers should take immediate steps to support unemployed workers through direct job creation in crucial sectors, like the Public Health Jobs Corp program proposed by President-elect Biden. 

  6. Expand access to upskilling opportunities and stable career pathways. Policymakers should proactively connect unemployed workers to good jobs by investing in workforce development, including higher education and training programs that reach Black workers, and enacting community workforce agreements on state-funded projects. Programs such as California’s Breaking Barriers to Employment Initiative, which funds workforce development programs for those with barriers to employment, should be strengthened and expanded while business leaders should commit to advancing equitable employment practices and offering good job opportunities to workers hard-hit by the pandemic.


*The California Employment Development Department defines workforce as all individuals residing in California who worked at least one hour per month for a wage or salary, were self-employed, or worked at least 15 unpaid hours per month in a family business. Those who were on vacation or on other kinds of leave were also included. 

Tackling Structural Racism Key to an Equitable Recovery in California

By Eliza McCullough, Sarah Treuhaft, and Abigail Langston

Data on unemployment filings in California reveals how the Black working class has been hardest hit by the Covid recession, underscoring the need for targeted, race-conscious recovery strategies. 

While the economic crisis has affected a startling number of workers, workers of color and low-wage workers have been hit the hardest. In California, 8.7 million workers (nearly 45 percent of the labor force) have filed for unemployment insurance (UI) since the start of the pandemic in March 2020. But job displacement has varied dramatically by race and education, as illustrated by the  California Policy Lab’s recent analysis of UI claims data. This post highlights how California’s Black workers are disproportionately experiencing unemployment in the Covid recession due to structural racism embedded in the labor market and describes policy priorities to ensure an equitable recovery.

!function(){"use strict";window.addEventListener("message",(function(a){if(void 0!==a.data["datawrapper-height"])for(var e in a.data["datawrapper-height"]){var t=document.getElementById("datawrapper-chart-"+e)||document.querySelector("iframe[src*='"+e+"']");t&&(t.style.height=a.data["datawrapper-height"][e]+"px")}}))}();

About 85 percent of California’s Black workforce has filed for unemployment at some point since March 15th, which is more than double the rate for White, Latinx, and Asian or Pacific Islander workers. This includes workers who filed for either regular UI or Pandemic Unemployment Assistance (PUA), a program created by the CARES Act to extend benefits to gig and contract workers. 

This disproportionate unemployment crisis for Black workers in a time of economic contraction threatens to increase already-wide racial inequities in employment. Structural racism embedded in the US labor market has created barriers to employment for Black workers that predate the current recession, ranging from employer bias and discrimination to residential segregation and mass incarceration. Black workers are typically the hardest hit group during economic downturns and are often the last to recover, as evidenced by the Great Recession when Black workers disproportionately suffered from long-term unemployment. The current economic crisis has most negatively impacted the hospitality, retail, and tourism sectors: industries in which Black workers are concentrated due in large part to discriminatory public policies that restricted Black workers’ access to better-paying jobs in other industries (a phenomenon known as “occupational segregation”). As these service sectors have gone through massive lay-offs, Black employees have been subject to the “last hired, first fired” phenomenon in which low-wage positions are first to go over higher seniority jobs.

!function(){"use strict";window.addEventListener("message",(function(a){if(void 0!==a.data["datawrapper-height"])for(var e in a.data["datawrapper-height"]){var t=document.getElementById("datawrapper-chart-"+e)||document.querySelector("iframe[src*='"+e+"']");t&&(t.style.height=a.data["datawrapper-height"][e]+"px")}}))}();

Further disaggregating the data by race and educational attainment, we see that racial inequities are particularly extreme among workers without four-year degrees. Workers of all races with lower education levels have been hardest hit by the Covid recession: 52 percent of California’s workers with a high school degree or less (who account for 38 percent of all workers in the state) have filed for unemployment since March 2020 compared to 13 percent of workers with a Bachelor’s degree or higher. But unemployment filings are particularly high for Black workers without post-secondary education: virtually all Black workers with a high school degree or less (99 percent) have filed for unemployment, along with 75 percent of Asian or Pacific Islander workers with this level of education, compared with 52 percent of White workers and 33 percent of Latinx workers.

Black workers are overrepresented in lower education groups due to deep-seated structures of racial exclusion which have created significant barriers to accessing higher education. Residential segregation, perpetuated by exclusionary zoning, has led to the concentration of low-income Black children in schools with inadequate resources (the school poverty indicator on the Atlas), which researchers have found is the key driver of the educational achievement gap. Along with the rising cost of college, these barriers prevent many Black students from accessing post-secondary education. As middle-wage jobs have shrunk in recent decades, Black workers with no higher education have been pushed into low-wage, ‘flexible’ positions with minimal protections. These jobs have been most impacted by wage cuts, diminished hours, and layoffs during the current economic crisis. 

Toward an Equitable Economic Recovery

Black workers and other workers of color are in dire need of increased supports in California and nationwide. Policymakers and business leaders must take action to address immediate economic needs as we enter the eleventh month of the pandemic. At the same time, they must launch forward-thinking, race-conscious strategies that  lay the foundation for an equitable recovery and future economy. We recommend the following:

  1. Continue expanded UI benefits and provide direct cash support. Additional UI payments under the Federal Pandemic Unemployment Compensation program should be increased back to $600/week (as provided from March to July) while gig workers and independent contractors must remain eligible for unemployment assistance. Additional and ongoing direct payments, such as the one-time $1,200 payments included in the CARES Act, could also provide a lifeline to unemployed workers and Black workers who are less likely to have adequate savings to fall back on.

  2. Prevent evictions and foreclosures and provide debt relief to Covid-impacted households. As unemployed workers are more likely to be behind on rent, policymakers must extend eviction moratoriums and provide rent debt relief. Rental assistance funds must target limited resources to the hardest-hit households, particularly those in predominantly Black neighborhoods and neighborhoods of color to prevent displacement and homelessness.  

  3. Protect existing jobs. Multiple cities have passed legislation that ensures employers in low-wage sectors guarantee laid-off workers return to their former jobs, such as Oakland’s Right to Recall policy which requires employers in hospitality and travel to give laid-off workers priority when operations resume. Similar policies that protect jobs across sectors must be passed at the state and federal level to ensure low-wage workers do not suffer from long-term decreases in income, benefits, or joblessness. 

  4. Build worker power. Unions have been shown to reduce racial inequality and provide economic security for Black workers. California policymakers must repeal Prop 22, which misclassifies app-based drivers as independent contractors and prevents their access to basic labor protections. Legislation that empowers workers, such as AB3075 which holds employers more accountable to wage theft, should be strengthened and expanded to ensure that recessions are less catastrophic for low-wage workers. 

  5. Create high-quality public jobs accessible to unemployed workers. A Federal Job Guarantee would ensure everyone has access to living-wage jobs while meeting the physical and care infrastructure needs of disinvested communities. Policymakers should take immediate steps to support unemployed workers through direct job creation in crucial sectors, like the Public Health Jobs Corp program proposed by President-Elect Biden.

  6. Expand access to stable career pathways. Policymakers should proactively connect unemployed workers to good jobs by  investing in workforce development, including higher education and training programs that reach  Black workers, and enacting community workforce agreements on state-funded projects. Programs such as California’s Breaking Barriers to Employment Initiative, which funds workforce development programs for those with barriers to employment, should be strengthened and expanded while business leaders should commit to advancing equitable employment practices and offering good job opportunities to workers hard-hit by the pandemic.

New Report and Upcoming Webinar: Race and the Work of the Future

Dear Atlas Users,

The results of this year’s elections are largely due to a historic groundswell of activism led by people of color and grassroots community organizations across the country. As the movement for racial equity continues to build momentum, the Atlas team is proud to partner with local leaders at the forefront of policy change. Our research this month highlights the urgent need to center low-income communities and people of color in both the ongoing Covid-19 recovery and in the long-term vision for a just and fair society. Here are some updates:

New Report Highlights Strategies for Inclusive Recovery and Equitable Future of Work

Today, the National Equity Atlas, in partnership with Burning Glass Technologies and the National Fund for Workforce Solutions, released our latest report, Race and the Work of the Future: Advancing Workforce Equity in the United States, a comprehensive analysis of long-standing racial gaps in labor market outcomes, the economic impacts of Covid-19, and the racial equity implications of automation. With in-depth analysis of disaggregated equity indicators and labor market dynamics, we found that White workers are 50 percent more likely than workers of color to hold good jobs, and that eliminating racial inequities in income could boost the US economy by $2.3 trillion a year. Read the full report here.

You’re Invited: Race and the Future of Work

Please join us on November 18 at 10 a.m. Pacific / 1 p.m. Eastern to learn about the findings of our new report: Race and the Work of the Future: Advancing Workforce Equity in the United States. We’ll also hear from workforce leaders moving equity-focused policies on the ground in Dallas and Seattle — including targeted strategies like skills-based hiring and apprenticeships and cross-sector partnerships that align workforce development with critical community supports like childcare, housing, and transportation. Register here.

For An Equitable Recovery, Invest in New Mexico’s Workers

Just like the coronavirus crisis itself, the economic crisis is hitting workers of color in New Mexico the hardest, particularly Native American workers, as they experience more layoffs and greater financial hardship than White workers. This new brief, authored by James Crowder of PolicyLink and produced in partnership with the Center for Workforce Development at San Juan College, describes conditions for New Mexico’s workers and presents a policy agenda for an inclusive recovery that leads with workforce equity.

Eviction Risk Analyses Released for California and Washington

The Atlas team has been supporting the Our Homes, Our Health housing justice effort by producing eviction risk fact sheets for local campaigns, advocating for strong renter protection and eviction moratorium policies across the country. This month, we published factsheets for California (with Housing NOW! California) and Washington (with Washington CAN), with many more in the works. Find them here.

National Equity Atlas at KIDS COUNT

The National Equity Atlas will be the featured data tool at a special session of the NY KIDS COUNT virtual conference, “All Data Are Local,” on December 2 at 10 a.m. Pacific / 1 p.m. Eastern. Registration is now open.

Thank you.

-- The National Equity Atlas team at PolicyLink and the USC Equity Research Institute

We’re Hiring! Build a Racial Equity Data Lab on the Atlas

Dear Atlas Users,

As we continue to support communities in their response to the Covid-19 pandemic, we have spent the past month producing new analyses, trainings, and factsheets powered by Atlas data. Partnerships with community organizations are driving this work forward. Here are a few highlights:

As the nation prepares for a historic election, the need for reliable, deeply disaggregated data to inform equity strategies is clearer than ever. The Atlas team has been hard at work this past month conducting unique analyses, building partnerships, and sharing our work with the field to strengthen local organizing and policy efforts. Here are some updates:

We’re Hiring for an Exciting New Partnership with Tableau

The Atlas team is excited to announce our new partnership with Tableau, a global leader in visual analytics. Through this partnership, we will build a new Racial Equity Data Lab on the Atlas, where users can create Tableau dashboards combining Atlas data with other data sources, and lead an Equity Data Fellowship to support leaders of color working in racial equity-focused organizations. We are recruiting a senior associate to lead this work. If you know of any candidates who are passionate about equipping equity advocates with data and visualizations, please send them our way. Read the full job description here.

Eviction Risk Analyses Released for Colorado and Bedford County, TN

The Atlas team has been supporting the Our Homes, Our Health housing justice effort by producing eviction risk fact sheets for local campaigns advocating for strong renter protection and eviction moratorium policies across the country. This month, we published factsheets for Colorado (with Colorado Homes For All, United for a New Economy, and 9to5) and Bedford County, TN (with the Bedford County Listening Project), with many more in the works. Find them here.

Atlas Team Shares Data Insights to Support Community-Led Equity Efforts

This month, Atlas team member Sarah Treuhaft participated in an SF Chronicle panel to discuss how the election could impact systemic racism in housing, criminal justice, and income inequality. She will also present today at the Center for an Urban Future policy forum to discuss municipal initiatives that can help build a more inclusive economy. Abbie Langston and James Crowder also presented to the Triangle J [North Carolina] Council of Governments, sharing the National Equity Atlas, the Racial Equity Index, and insights for policymakers from our equity data partnerships in the region.

City of Seattle Draws on Atlas Data for Equitable Development Community Indicators Report

The City of Seattle released an Equitable Development Community Indicators Report last month as part of its Equitable Development Monitoring Program. The report reveals key racial inequities in Seattle, finding that residents of color have longer commutes to work than their White counterparts, the city lacks adequate family-size rental housing, and people of color are underrepresented among business owners. The authors relied on Atlas data for many of the indicators. As lead author Diana Canzoneri notes, “One of the especially valuable aspects of the Atlas is the detailed disaggregation by race, ethnicity, and place of birth. This feature of the Atlas made it easy for us to find and integrate examples of disparities between subgroups that would have otherwise been masked.” Read the full report here.

Thank you.

-- The National Equity Atlas team at PolicyLink and the USC Equity Research Institute

Using Disaggregated Data to Advance an Equitable Recovery

Dear Atlas Users,

As we continue to support communities in their response to the Covid-19 pandemic, we have spent the past month producing new analyses, trainings, and factsheets powered by Atlas data. Partnerships with community organizations are driving this work forward. Here are a few highlights:

Atlas Analyses Power Campaigns to Extend Eviction Moratoriums Nationwide

The Atlas team is supporting the Our Homes, Our Health housing justice effort by producing eviction risk fact sheets for local campaigns. These resources include data on how many households are currently at risk of eviction, which households are rent burdened and economically insecure by race/ethnicity and gender, and the first-hand experience of renters impacted by the economic downturn. This month, we published factsheets for Kansas (with Rent Zero Kansas) and Kentucky (with the Lexington Housing Justice Collaborative), with many more in the works. Find them here.

Webinar Archive: Unlocking the Insights of Disaggregated Data

This month, the Atlas team led a webinar training on how to unlock the power of disaggregated data for cities, regions, and states. We provided a step-by-step walk through of the newly revamped National Equity Atlas and our custom indicators database, which offers unparalleled data disaggregation by race/ethnicity, gender, nativity, ancestry, and more. This training was designed to equip Atlas users with the know-how to access, understand, share, and use disaggregated data to foster more equitable communities. Check out the recording here.

You’re Invited: Policy Insights for an Equitable Economic Recovery with the NY Federal Reserve

On September 24, the Federal Reserve Bank of New York will lead a conversation about the impact of Covid-19 on communities of color. The forum will focus on key policy areas necessary for an equitable recovery, including credit markets, the racial wealth gap, and workforce equity. Sarah Treuhaft, vice president of research at PolicyLink, will participate in a practitioner panel with other racial and economic equity leaders to discuss findings and policy recommendations from our recent report, Race, Risk and Workforce Equity in the Coronavirus Economy. Register for the forum here.

Thank you for your interest in our work.

-- The National Equity Atlas team at PolicyLink and the USC Equity Research Institute

The Racial Equity Index: A New Data Tool to Drive Local Efforts to Dismantle Structural Racism

New index reveals significant racial inequities even in the most prosperous cities and metros; provides data to help leaders develop targeted strategies for inclusive prosperity

By Sarah Treuhaft, Abbie Langston, Justin Scoggins, Joanna Lee, and Manuel Pastor

Racial equity is the defining issue of our time. The brutal murder of George Floyd — amidst a pandemic disproportionately harming the health and livelihoods of Black, Latinx, and Indigenous people — put dismantling structural racism at the center of our national policy debate.

Against this long overdue nationwide reckoning, community leaders are searching for policy solutions that can transform systems and structures and make meaningful progress toward racial equity. Disaggregated data at the local level is crucial to this endeavor: achieving equity requires targeted solutions that address structural and institutional racism, eliminate the barriers that prevent people from thriving, and provide the resources and opportunities that people need to reach their full potential. And data that reveals which groups are being excluded, by how much, and in what policy areas is an essential ingredient to develop effective strategies that match the scale of the challenge.

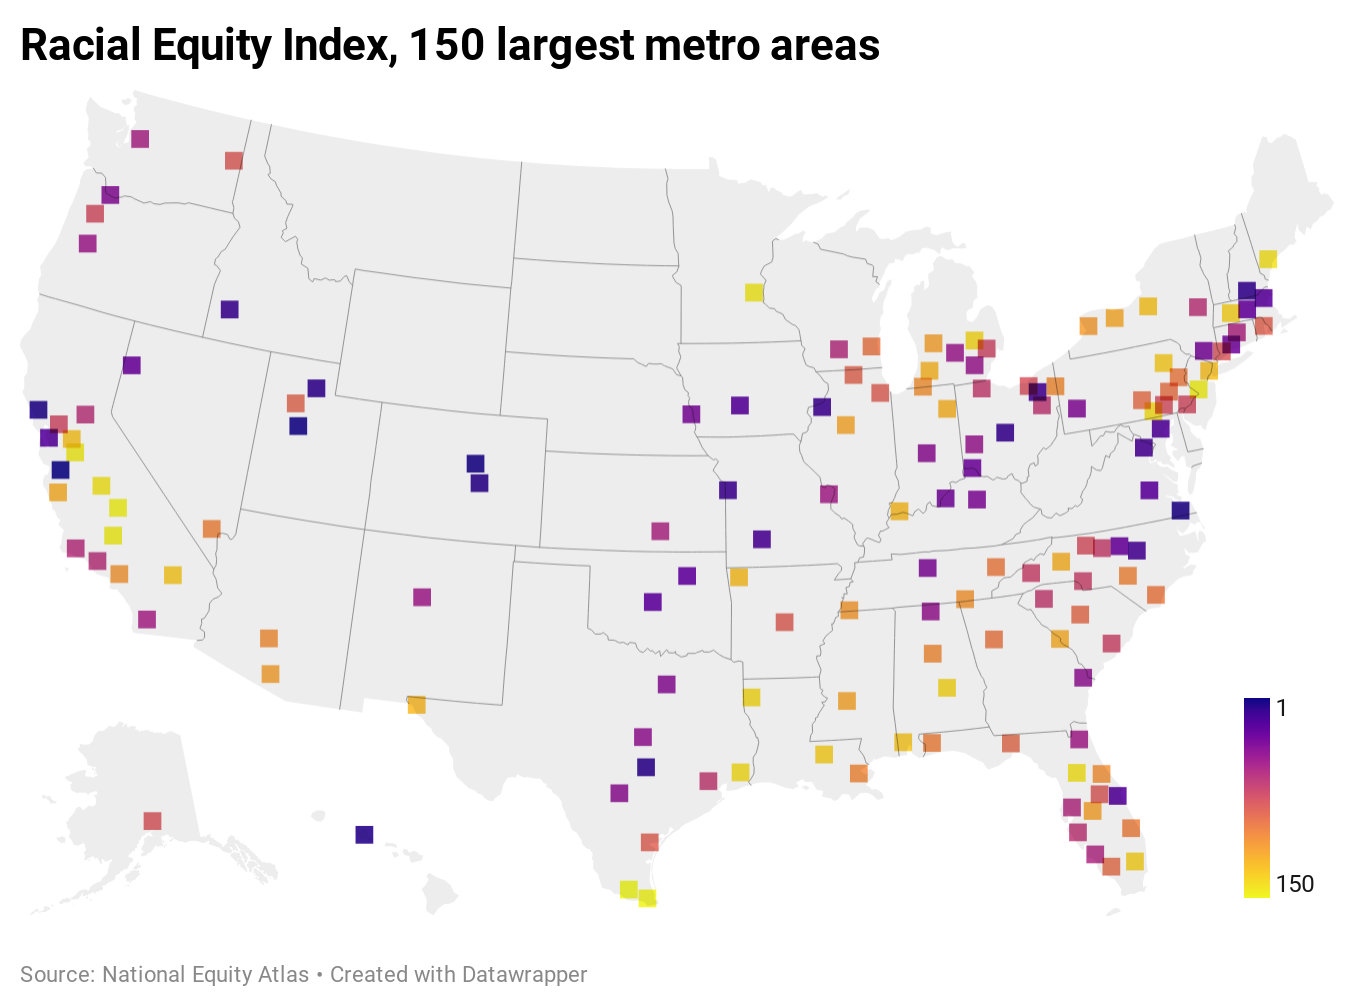
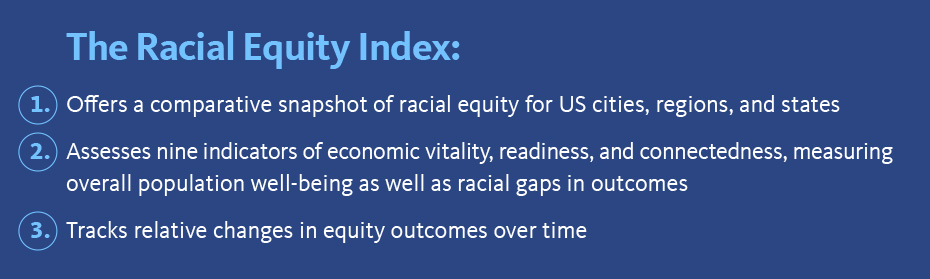
The Racial Equity Index is the nation’s first-ever tool designed to support communities in advancing equity solutions by measuring the state of equity in the 100 largest U.S. cities, the 150 largest metros, and all 50 states on key indicators of prosperity and inclusion by race. The Index is an integrated and holistic measure to compare the state of equity across different places, developed in response to the demand for a more comprehensive, summary picture of how communities were doing on our equity metrics. It provides a snapshot of how well a given place is performing on racial equity compared to its peers — comparing cities to cities, regions to regions, and states to states. Because equity means both closing racial gaps and ensuring that everyone is doing well, the Racial Equity Index is based on two components: an inclusion score that indicates the extent of racial gaps in outcomes for a series of nine equity indicators (wages, unemployment, poverty, educational attainment, disconnected youth, school poverty, air pollution, commute time, and housing burden) and a prosperity score that indicates how well the population is doing overall on those same indicators.

This analysis shares insights from our analysis of the Index for cities and metros. Please see Introducing the Racial Equity Index to learn more about the Index and how to use it and explore the data for your community with the Index data tool.   

Key findings from the Racial Equity Index include:

  1. Every community is hindered by systematic racial inequities. Even in the best-performing places on the Index, there are significant and preventable racial inequities.

  2. Inclusive prosperity remains elusive among America’s metros and cities. It is very rare for communities to have high levels of prosperity, in terms of overall performance on the indicators, and high levels of inclusion, in terms of low racial disparities. 

  3. Robust economic growth alone does not bring about racial equity and inclusion. While some of the regions with the most dynamic economies perform well on the Index, overall there is a weak relationship between traditional measures of economic development such as job growth, and racial equity and inclusion.

  4. Achieving racial equity requires improving conditions in the population centers where most people of color live. Few of the cities with the largest Black and Latinx populations perform well overall on the Index or on Black or Latinx prosperity.

  5. Racial equity is not a zero-sum proposition. Most of the cities and regions with the best outcomes for communities of color also have good outcomes for their White residents, and vice versa.

Each of these is further described below.
 

1. Every community is hindered by systematic racial inequities.

The Index reveals just how far all cities and metros have to go to correct systems that are perpetuating racial inequities. Because it is a relative Index, even places that are the top performers have significant racial inequities. 

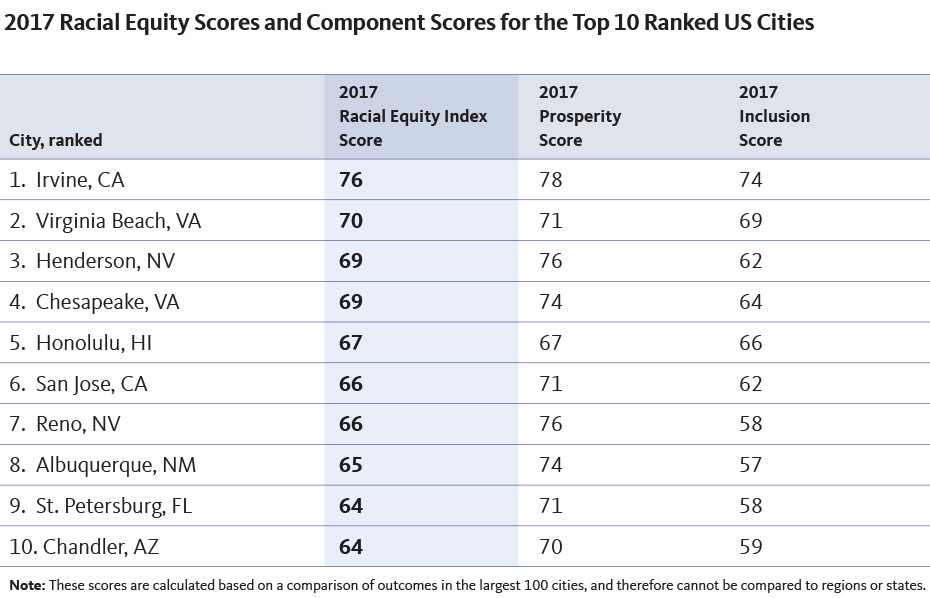
Take the region of San Jose, California. The tech epicenter has the highest score on the Racial Equity Index because of its strong overall performance in terms of wages, poverty, educational attainment, and school poverty and relatively lower racial disparities on indicators of air pollution, commute time, educational attainment, and unemployment. 

Yet, there are large racial inequities in San Jose. For example, even with the highest share of Black college graduates of any region (37 percent), there is a 23 percentage point Black-White disparity in terms of educational attainment, and the White-Latinx disparity is 44 percentage points (60 and 16 percent, respectively). And among college graduates, Black and Latinx workers earn $12-$17 less per hour than White and Asian or Pacific Islander workers. Note that while the regional median wage for the Asian or Pacific Islander population as a whole is $43, median wages vary significantly within that group


2. Inclusive prosperity remains elusive among America’s metros and cities. 

Equitable communities both have strong overall performance on indicators of well-being and low racial disparities, which is why the Racial Equity Index combines a prosperity score and an inclusion score. But what we see is that very few places are both doing well on prosperity and inclusion. 

The metros that have the best overall performance on the indicators are not the most inclusive and tend to have wide racial disparities. Among top 25 regions on the prosperity score, none are also in the top 25 on the inclusion score, and only seven even make the top 100 on inclusion. Eighteen of them are in the bottom 50 on inclusion, including the Minneapolis-St. Paul region, which has the sixth highest prosperity score, but is second from the bottom in terms of its inclusion score.


3. Robust economic growth alone does not bring about racial equity and inclusion.

Over the past decade coming out of the Great Recession, growth in jobs and economic output has been concentrated in a small number of large metros, and within those places economic gains have largely gone to investors, corporations, and a small number of highly-educated knowledge economy workers.

A look at post-recession job growth in regions in relation to the Racial Equity Index underscores the weak relationship between job growth and racial equity. While there is some correlation between job growth and racial equity performance, with some high-growth metros like Austin, Denver, Raleigh, and San Jose performing well on the Index, the connection is not strong. Similarly, strong job growth does not drive positive outcomes for Black and Latinx residents. Of the 25 metros with the highest post-recession job growth, only seven of them were among the top 25 regions on prosperity for Black residents (Austin, Denver, Dallas, Fayetteville, Raleigh, San Jose, and San Antonio). And only three of them were among the top 25 regions on prosperity for Latinx residents (San Francisco, Austin, and Provo).

4. Achieving racial equity requires improving conditions in the population centers where most people of color live.

About 29 percent of Black people in the United States live in just 50 cities, underscoring the importance of integrating place-based and people-focused solutions to advance racial equity. The concentration of different racial/ethnic groups in certain regions, cities, and neighborhoods is in large part a consequence of systems and policies that produced and reinforced racial segregation — and the persistence of inequities in those places follows from a long history of disinvestment and deprivation. Some of the highest scoring cities on the Racial Equity Index have the smallest Black populations: In seven out of the top 10 performers, the Black population is significantly underrepresented compared to the national share (Albuquerque, Chandler, Henderson, Honolulu, Irvine, Reno, San Jose). Similarly, the Latinx population is underrepresented in six of the top 10 cities on the Index (Chesapeake, Henderson, Honolulu, Irvine, Virginia Beach, St. Petersburg).

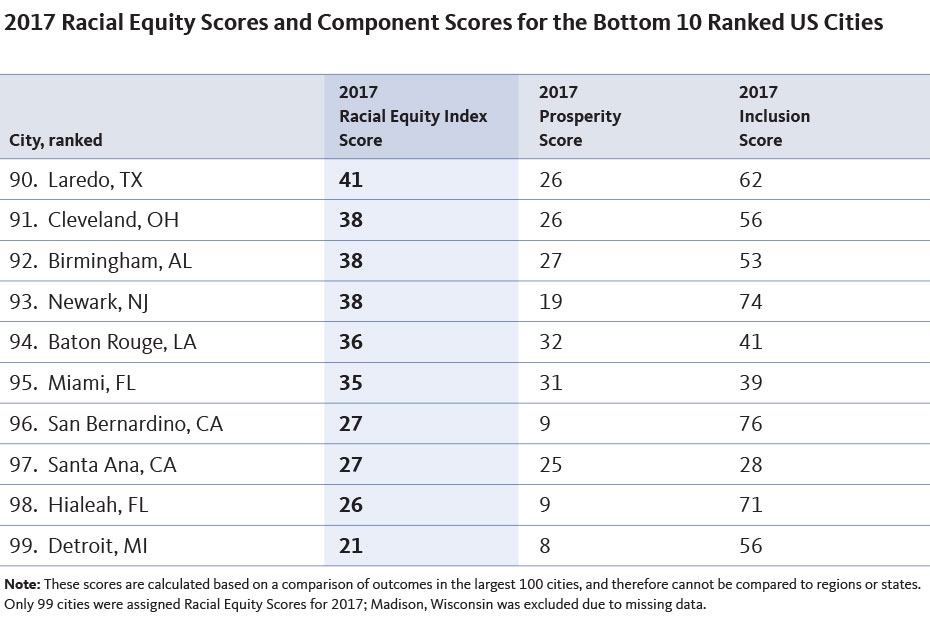
Of the 12.9 million Black people living in the largest 100 cities, about 80 percent of them live in the 33 cities with at least 100,000 Black residents. Only two of these cities are among the top 20 performers on the Racial Equity Index (Nashville and Norfolk), and 10 are among the bottom 20 performers (Atlanta, Baton Rouge, Birmingham, Cleveland, Dallas, Detroit, Houston, Memphis, Newark, and New York). Only two — Durham and Raleigh, which are in the same region — are among the top 20 performers for Black prosperity, and wide racial gaps in prosperity are evident in these places:


Similar trends hold for Latinx people. Among the 41 cities with at least 100,000 Latinx residents, only two (Albuquerque and San Francisco) rank in the top 20 prosperity scores for the Latinx population, while 12 (Charlotte, Dallas, Fresno, Hialeah, Los Angeles, Milwaukee, Oklahoma City, Philadelphia, Phoenix, San Bernardino, Santa Ana, and Newark) are in the bottom 20.

The cities with the best outcomes for Latinx residents tend to have relatively small Latinx populations: among the top 20 performers on Latinx prosperity, nine were among the 20 cities with the smallest Latinx populations and only five have Latinx populations at 50,000. The same dynamics are found at the regional level.

In the 25 regions with the largest Latinx populations, only two ranked in the top 25 for regional prosperity scores on the Racial Equity Index (Boston and San Jose), and just three were among the top 25 performers for Latinx prosperity (Austin, San Francisco, and Washington DC). Even among those best performers, Latinx residents still face significant racial inequities on key indicators of prosperity.

5. Racial equity is not a zero-sum proposition.

Looking at the prosperity scores across racial/ethnic groups, we find that most of the cities and regions with the best outcomes for communities of color also have above-average outcomes for their White residents, and vice versa. Of the top 20 cities for prosperity for people of color, for example, all but two of them are in the top 40 for White prosperity, all but one are in the top 40 for Black prosperity (among the 16 with large enough Black populations to generate Black prosperity scores), and all but one are in the top 40 for Latinx prosperity.

And of the top 20 cities for White prosperity, six — Anchorage, Austin, Denver, Durham, Plano, and Raleigh — are also in the top 20 for Black prosperity (among the 16 with large enough Black populations to generate Black prosperity scores) and six are in the top 20 for Latinx prosperity (Anchorage, District of Columbia, Irvine, Plano, San Francisco, and Scottsdale). Only one — Dallas — falls in the bottom 20 for both Black and Latinx prosperity.
 

Making Progress on Racial Equity Will Require Tailored and Bold Solutions

Our analysis of the Racial Equity Index for cities and metros reveals that even the best performing places exhibit significant racial disparities, and even the places with the most economic success post-recession fall short on equity. At a time when Black, Latinx, Native American, and Pacific Islander communities are the hardest hit by another recession, it is imperative that leaders at all levels recognize that targeted, race-conscious strategies are necessary to bring about an inclusive recovery. Doing so will create tremendous benefits that cascade up and out to the advantage of an entire community. Equity is the path to prosperity: By developing solutions that are informed by and effectively reach the people most impacted by structural racism and economic inequality, we can build an equitable, prosperous future economy.

Identify Priority Issues for an Equitable Recovery with the New Racial Equity Index for Cities

The Racial Equity Index is our newest data tool for local action, designed to provide a single comparative metric for racial equity across the United States. Here, we share the rankings and key insights from the Racial Equity Index for the 100 largest cities in the United States in 2017. Visit the Racial Equity Index to explore all of the available data, including data for regions, states, and other points in time.


The 2017 Racial Equity Index rankings offer a unique snapshot of how US cities stack up on overall equity outcomes. Racial Equity Index values for the 100 largest cities ranged from 21 (Detroit, Michigan) to 76 (Irvine, California), indicating that no single place fared the best on every measure (which would have resulted in a score of 100), nor did any place perform the worst on all measures.

It is important to note that because all values are relative — meaning they measure how well a city is doing compared to other cities — even the top performer has room for improvement. For example, the city-level inclusion scores, which indicate the relative size of racial gaps, ranged from 26 (Scottsdale, Arizona) to 81 (Garland, Texas). But even among cities with high inclusion scores, pronounced racial gaps are evident. In Garland, for example, prosperity is not equitably shared, as illustrated in the chart below. In every indicator category, scores for Black and Latinx residents trail those for the White population.

Latinx residents in Garland experience the deepest inequities in Economic Vitality and Readiness indicators.

The city-level prosperity scores span an even broader range, from 8 (Detroit, Michigan) to 78 (Fremont, California — a Bay Area suburb). This reveals the stark differences in economic and social outcomes in the wake of the Great Recession, as the recovery was very uneven and concentrated wealth and prosperity in a small number of regions (such as the San Francisco Bay Area) while legacy and post-industrial regions continued to struggle.

Top 10 Cities Concentrated in the West and Southwest

The table below shows the top 10 cities on the Racial Equity Index for 2017, as well as the inclusion and prosperity scores for each place. The cities on this list represent a diversity of local economies, from those dominated by manufacturing, transportation, and tourism to others specialized in financial services, energy technology, and aerospace.

Some of the top 10 cities (such as Irvine and Virginia Beach) have high Racial Equity Index scores driven by high scores for both inclusion and prosperity. In these places, overall population outcomes are, on average, better and more racially equitable than in other cities.

Other cities on the list (like Reno and Albuquerque) have high inclusion scores but much lower prosperity scores, indicating that while racial gaps are relatively small in these cities, overall population outcomes trail those in other places.

1. Irvine, California

Irvine earned the top spot on the Racial Equity Index for cities in 2017 with the sixth-highest inclusion score among cities and the third-highest prosperity score. In other words, it performed quite well in terms of both overall outcomes and in terms of racial inclusion.

Irvine’s top ranking is driven by its standout scores in the Readiness category: educational attainment, disconnected youth, and school poverty. The city ranked #1 for prosperity (overall outcomes) in educational attainment (BA degree or higher), and #2 for racial inclusion in educational attainment. It was also at the top of the lists for overall lowest levels of school poverty (#1) and disconnected youth (#2).

Yet Irvine is not without its challenges, with average or below-average prosperity scores in the Connected category: air pollution exposure (#51), commute time (#50), and rent burden (#74): more than half of renter households in Irvine spend more than 30 percent of their income on housing costs. And while the city had a high prosperity score for poverty/economic insecurity (#10), it ranked #73 out of 100 for inclusion on the same indicator: 46 percent of Latinx immigrants in Irvine are economically insecure, meaning they have family incomes below 200 percent of the federal poverty level — about three times the rate of US-born White residents (16 percent).

8. Albuquerque, New Mexico

Albuquerque was ranked #8 on the 2017 Racial Equity Index, with the #17 inclusion score and the #32 prosperity score.

The city had slightly above-average prosperity scores (overall outcomes) in median wages (#40) and unemployment (#46), but ranked in the top quarter of cities in terms of racial inclusion for these indicators. The city’s inclusion scores for median wages (#22) and unemployment (#21) signal that Albuquerque has smaller racial gaps for these important Economic Vitality indicators than most of its peer cities. Still, the median wage of Native American workers ($15 per hour) is far lower than that of White workers ($24 per hour). In fact, the median wage for Native American workers in Albuquerque is $2 less per hour than the national average for Native Americans, while the median wages for White, Black, and Latinx workers in Albuquerque are all higher than the respective national averages.

On other measures, however, Albuquerque is less racially inclusive. The city’s inclusion scores were just above average for economic insecurity (#43) and disconnected youth (#44), although 24 percent of Native American youth in the city are neither working nor in school — twice the rate for White youth. And while it scored well on prosperity for air pollution exposure (#17), its inclusion score for that indicator was near the bottom of the list (#93) due to large racial gaps.

9. St. Petersburg, Florida

St. Petersburg ranked ninth on the 2017 Racial Equity Index for cities, with the #29 inclusion score and the #27 prosperity score.

In 2017, St. Petersburg placed above the median prosperity score for seven of the nine indicators in the index, but landed in the bottom half of cities for disconnected youth (#57) and rent burden (#57).
St. Petersburg’s most positive showing was on the Economic Vitality indicator of economic insecurity. Its prosperity score (#23) and inclusion score (#20) were both relatively high, landing the city in the top 25 for both overall population outcomes and relatively smaller racial gaps in economic insecurity, but steep inequities are still evident: 55 percent of US-born Black residents and 45 percent of US-born Asian or Pacific Islander residents in St. Petersburg are economically insecure, compared to 27 percent of the US-born White population.

St. Petersburg had the nation’s fifth-highest inclusion score for educational attainment, but the share of adults with at least a bachelor’s degree ranged from 15 percent for Black men to 47 percent for Asian or Pacific Islander women.

Many Legacy Cities Among the Bottom 10 on the Racial Equity Index

The table below shows the bottom 10 cities on the Racial Equity Index for 2017, as well as the inclusion and prosperity scores for each place. Several of these places could be categorized as “Legacy Cities” that struggled to recover from the decline of manufacturing and significant population loss even before the Great Recession. While a few of these places — Newark and San Bernardino, notably — have high inclusion scores comparable to the top-ranked cities — their very low prosperity scores indicate that their smaller racial gaps are accompanied by widely shared hardship.

94. Baton Rouge, Louisiana

In 2017, Baton Rouge was ranked #94 on the Racial Equity Index for cities, with the #91 inclusion score and the #87 prosperity score.

Baton Rouge simultaneously had the lowest prosperity score in the nation for air pollution exposure and the highest inclusion score for the same indicator, meaning the overall outcomes were the worst among the 100 largest US cities, and affected all racial/ethnic groups similarly.

Baton Rouge’s highest prosperity scores were for commute time (#23) and disconnected youth (#29), indicators that returned two of the city’s lowest inclusion scores: #75 for commute time and #98 — last place — for disconnected youth. Overall, 11 percent of youth in the city are neither working nor in school, but the share varies tremendously by race: among Black youth in the city, 20 percent are disconnected from work and school — 10 times the rate of their White peers (2 percent).

96. San Bernardino, California

In 2017, San Bernardino had the ninth highest inclusion score among the 100 largest cities, but the third lowest prosperity score. San Bernardino trails behind almost every other large city for overall population outcomes.

San Bernardino landed among the bottom five lowest prosperity scores on seven of the nine index indicators, but White residents — who make up just 15 percent of the city’s population — fare much better than other racial/ethnic groups. In 2017, the prosperity score for the White population in San Bernardino was 33 — far below the national median, but significantly higher than the scores for the Black (10) and Latinx (9) populations in the city.

99. Detroit, Michigan

Detroit ranked at the bottom of the 2017 Racial Equity Index for cities, with the lowest prosperity score and the 26th lowest inclusion score. In essence, overall population outcomes in Detroit are the worst in the nation, and racial inequities are especially pronounced.

The city’s low prosperity score is driven by the Economic Vitality indicators (median wage, unemployment, economic insecurity) and the Readiness indicators (educational attainment, disconnected youth, and school poverty). Detroit ranked in the bottom seven out of 100 cities on all of these indicators. Economic insecurity has increased significantly for all racial/ethnic groups in Detroit over the past few decades: in 2017, 72 percent of Asian or Pacific Islander households and 72 percent of Latinx residents in the city had family incomes below 200 percent of the federal poverty level, along with 62 percent of Black residents and 59 percent of White residents.

Targeted Solutions that Prioritize the Most Impacted Communities Are the Key to Thriving, Equitable Cities

Strategies tailored to advance just and fair inclusion for the communities most impacted by structural racism and economic inequality are not only the morally right thing to do — they are also the best way to ensure greater prosperity and well-being for all. Directing resources and innovation to where the need is greatest can create tremendous benefits that cascade up and out to the advantage of an entire city. But entrenched racial inequities are often obscured in policymaking and public discourse, making it difficult to home in on the systems and populations that ought to be prioritized. The Racial Equity Index offers an innovative tool to unlock the power of disaggregated data and make the case for policies to cultivate equitable cities where all people can participate, prosper, and reach their full potential.

Testing visuals

Introducing the Racial Equity Index

The National Equity Atlas team is excited to announce the launch of the Racial Equity Index, our newest data resource designed to provide a single comparative metric for racial equity in US cities, regions, and states.

Six years ago, we created the National Equity Atlas as a tool to measure, track, and make the case for inclusive growth. With 30 indicators measuring demographic change, multiple dimensions of economic and social equity, and the economic benefits of racial economic inclusion, the Atlas presents deeply disaggregated data, and hundreds of customizable displays, for 301 geographies.

Now, for the first time, it also includes an integrated and holistic measure to compare the state of equity across different places, developed in response to your call for a more comprehensive, summary picture of how communities were doing on our equity metrics. The Racial Equity Index is designed to support advocates, policymakers, and other leaders to quickly understand the issue areas where outcomes are most inequitable, and the populations who are most impacted. This innovative tool can help communities identify priority areas for advancing racial equity, track progress over time, and set specific goals for closing racial gaps.

The Racial Equity Index is a summary score that provides a snapshot of how well a given place is performing on racial equity compared to its peers — comparing cities to cities, regions to regions, and states to states. Because equity means both closing racial gaps and ensuring that everyone is doing well, the Racial Equity Index is based on two components: an inclusion score that indicates the extent of racial gaps in outcomes for a series of nine equity indicators, and a prosperity score that indicates how well the population is doing overall on those same indicators.

How It Works

First, each geography is assessed based on a set of nine unique equity indicators from the National Equity Atlas, as shown in the table below. For every geography, each indicator is translated into an inclusion value, ranging from 1 to 100, where 100 indicates the most racially inclusive outcomes observed for the geographic type (city, region, or state). The composite inclusion value for all nine indicators becomes the inclusion score for that place. (For more information on the construction of the index, see the methodology.)

Next, each indicator is converted into a prosperity value, also ranging from 1 and 100, where 100 indicates the most positive overall outcome for that geographic type. The composite prosperity value for all nine indicators is calculated for the whole population in that geography, and the result is the prosperity score for that place.

Finally, the prosperity score and the inclusion score are averaged to derive the Racial Equity Index, reflecting overall population outcomes as well as racial/ethnic inclusion.


We selected these indicators to capture a range of both people-focused and place-based equity metrics that are available for all geographies in the National Equity Atlas, to include a range of interrelated systems where structural racism is manifest, and to allow for tracking change over time (both retrospectively and in the future). This set of indicators does not encompass all dimensions of racial equity; notably, we are not able to integrate any measures related to the criminal-legal system or wealth due to limited data availability.

What It Shows

The Racial Equity Index is designed to compare equity outcomes — using a composite score for both inclusion and prosperity — for one type of geography at a time to see how a place is doing relative to its peers. Scores are calculated independently for each point in time reported in the Index, so changes over time should be understood as relative changes (that is, a change in ranking compared to the performance of peer geographies) rather than as absolute changes in indicator values.

In addition to reporting the overall inclusion score and prosperity score for each place, the Racial Equity Index overview breaks down outcomes in each geography by the three indicator categories shown in the table above: Economic Vitality, Readiness, and Connectedness.

Along with the raw indicator data included on the National Equity Atlas, this comparative analysis helps to identify the issue areas in greatest need of improvement for a given place. For instance, the Minneapolis metro has one of the highest prosperity scores among the 150 largest metropolitan regions (#6 out of 150), but one of the lowest inclusion scores (#149 out of 150). This indicates that while overall population outcomes are better in Minneapolis than in most other regions, racial gaps are more pronounced. A couple of examples can help illustrate this dynamic.

In the Minneapolis region, the overall rate of poverty/economic insecurity (the share of people with household incomes below 200 percent of the federal poverty level) is 23 percent — one of the lowest in the nation. But this figure obscures tremendous racial inequities: just 16 percent of White residents in the Minneapolis metro are economically insecure, compared to 57 percent of Black residents and 50 percent of Native American residents. This is reflected in the region’s Racial Equity Index scores for poverty: a prosperity score of 92 (because the overall rate is better than in most other places), but an inclusion score of 1 (indicating that racial inequities for this indicator were worse than any other region). The Racial Equity Index reveals that in the Minneapolis metro, building an equitable economy will depend on solutions that reduce poverty, support economic security, and build pathways to the middle class targeted to the Black, Indigenous, and Latinx populations experiencing the greatest inequities. The differences between the region's prosperity and inclusion scores for each indicator are illustrated in the charts below.The Minneapolis region scores well for prosperity across all indicators, especially unemployment and poverty/economic insecurity, but is in the bottom half of regions for eight out of ten indicators.


Note that the Racial Equity Index should not be used to compare different geographic types; for example, you can use the index to compare the performance of the largest cities in Texas, but you cannot use it to compare Houston’s performance to the state overall.

Prosperity Scores by Race/Ethnicity

The index also powers another unique metric for understanding equity within and across different places: prosperity scores by race/ethnicity. These scores offer a snapshot of prosperity score gaps between racial/ethnic groups, revealing which groups are doing well and which are not, providing deeper context for understanding the overall scores for a given place.

Prosperity scores by race/ethnicity are derived for each geography for the six major racial/ethnic groups, and for all people of color combined. Because these scores are derived from the overall prosperity scores in each place, they can be used to make comparisons across racial/ethnic groups within a given place as well as between places (again, comparing cities only to cities, regions only to regions, and states only to states).

For example, among the 100 largest cities, the prosperity score for the Black population is highest in Plano, Texas (with a score of 67), signaling that Black residents of Plano are faring better on the underlying indicators than their counterparts in other cities. Yet Plano’s Black population still experiences significant racial gaps in most index indicators, especially educational attainment and median wages, as shown in the chart below.

The largest equity gaps facing Plano’s Black community are for the indicators of educational attainment, median wage, and poverty/economic insecurity. This snapshot can help advocates contextualize the more detailed data in the National Equity Atlas when comparing equity outcomes within their city and across neighboring or peer cities. Black workers in Plano have a median wage of $23 per hour — higher than the national average of $18 for all Black workers in the United States, but significantly trailing the city’s overall median wage of $29 per hour.

To learn more, see our analysis for some of the key findings for cities and metros, or visit the Racial Equity Index summary page to explore the data for your city, region, or state.

Pages