
Introducing the Racial Equity Index
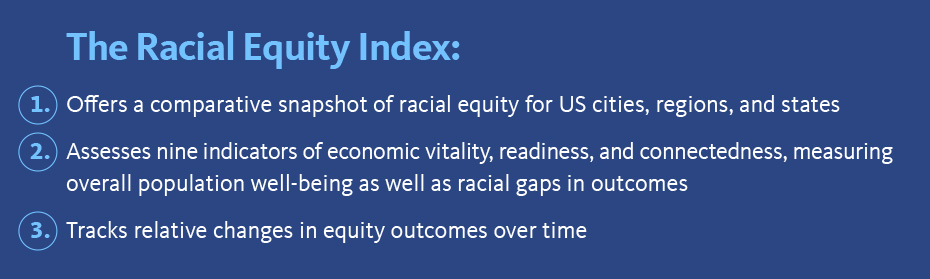
The National Equity Atlas team is excited to announce the launch of the Racial Equity Index, our newest data resource designed to provide a single comparative metric for racial equity in US cities, regions, and states.
Six years ago, we created the National Equity Atlas as a tool to measure, track, and make the case for inclusive growth. With 30 indicators measuring demographic change, multiple dimensions of economic and social equity, and the economic benefits of racial economic inclusion, the Atlas presents deeply disaggregated data, and hundreds of customizable displays, for 301 geographies.
Now, for the first time, it also includes an integrated and holistic measure to compare the state of equity across different places, developed in response to your call for a more comprehensive, summary picture of how communities were doing on our equity metrics. The Racial Equity Index is designed to support advocates, policymakers, and other leaders to quickly understand the issue areas where outcomes are most inequitable, and the populations who are most impacted. This innovative tool can help communities identify priority areas for advancing racial equity, track progress over time, and set specific goals for closing racial gaps.
How It Works
First, each geography is assessed based on a set of nine unique equity indicators from the National Equity Atlas, as shown in the table below. For every geography, each indicator is translated into an inclusion value, ranging from 1 to 100, where 100 indicates the most racially inclusive outcomes observed for the geographic type (city, region, or state). The composite inclusion value for all nine indicators becomes the inclusion score for that place. (For more information on the construction of the index, see the methodology.)
Next, each indicator is converted into a prosperity value, also ranging from 1 and 100, where 100 indicates the most positive overall outcome for that geographic type. The composite prosperity value for all nine indicators is calculated for the whole population in that geography, and the result is the prosperity score for that place.
Finally, the prosperity score and the inclusion score are averaged to derive the Racial Equity Index, reflecting overall population outcomes as well as racial/ethnic inclusion.
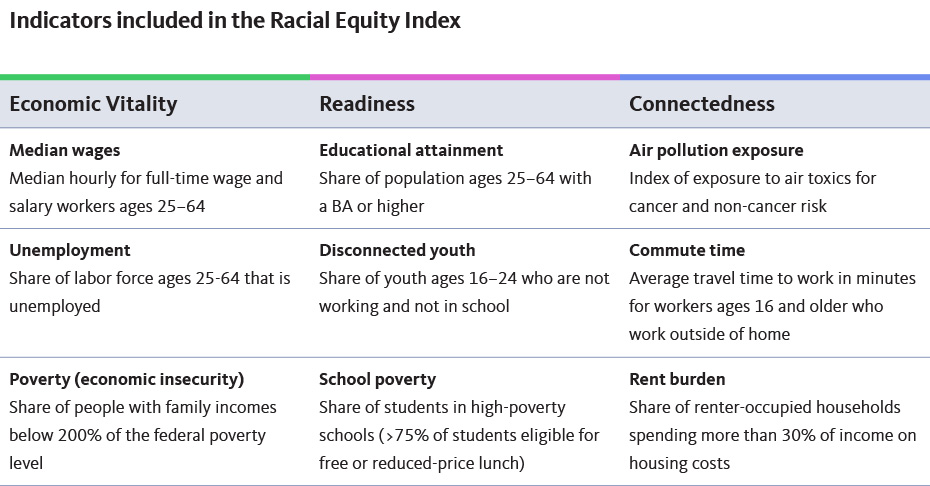
We selected these indicators to capture a range of both people-focused and place-based equity metrics that are available for all geographies in the National Equity Atlas, to include a range of interrelated systems where structural racism is manifest, and to allow for tracking change over time (both retrospectively and in the future). This set of indicators does not encompass all dimensions of racial equity; notably, we are not able to integrate any measures related to the criminal-legal system or wealth due to limited data availability.
What It Shows
The Racial Equity Index is designed to compare equity outcomes — using a composite score for both inclusion and prosperity — for one type of geography at a time to see how a place is doing relative to its peers. Scores are calculated independently for each point in time reported in the Index, so changes over time should be understood as relative changes (that is, a change in ranking compared to the performance of peer geographies) rather than as absolute changes in indicator values.
In addition to reporting the overall inclusion score and prosperity score for each place, the Racial Equity Index overview breaks down outcomes in each geography by the three indicator categories shown in the table above: Economic Vitality, Readiness, and Connectedness.
Along with the raw indicator data included on the National Equity Atlas, this comparative analysis helps to identify the issue areas in greatest need of improvement for a given place. For instance, the Minneapolis metro has one of the highest prosperity scores among the 150 largest metropolitan regions (#6 out of 150), but one of the lowest inclusion scores (#149 out of 150). This indicates that while overall population outcomes are better in Minneapolis than in most other regions, racial gaps are more pronounced. A couple of examples can help illustrate this dynamic.
In the Minneapolis region, the overall rate of poverty/economic insecurity (the share of people with household incomes below 200 percent of the federal poverty level) is 23 percent — one of the lowest in the nation. But this figure obscures tremendous racial inequities: just 16 percent of White residents in the Minneapolis metro are economically insecure, compared to 57 percent of Black residents and 50 percent of Native American residents. This is reflected in the region’s Racial Equity Index scores for poverty: a prosperity score of 92 (because the overall rate is better than in most other places), but an inclusion score of 1 (indicating that racial inequities for this indicator were worse than any other region). The Racial Equity Index reveals that in the Minneapolis metro, building an equitable economy will depend on solutions that reduce poverty, support economic security, and build pathways to the middle class targeted to the Black, Indigenous, and Latinx populations experiencing the greatest inequities. The differences between the region's prosperity and inclusion scores for each indicator are illustrated in the charts below.The Minneapolis region scores well for prosperity across all indicators, especially unemployment and poverty/economic insecurity, but is in the bottom half of regions for eight out of ten indicators.
Note that the Racial Equity Index should not be used to compare different geographic types; for example, you can use the index to compare the performance of the largest cities in Texas, but you cannot use it to compare Houston’s performance to the state overall.
Prosperity Scores by Race/Ethnicity
The index also powers another unique metric for understanding equity within and across different places: prosperity scores by race/ethnicity. These scores offer a snapshot of prosperity score gaps between racial/ethnic groups, revealing which groups are doing well and which are not, providing deeper context for understanding the overall scores for a given place.
Prosperity scores by race/ethnicity are derived for each geography for the six major racial/ethnic groups, and for all people of color combined. Because these scores are derived from the overall prosperity scores in each place, they can be used to make comparisons across racial/ethnic groups within a given place as well as between places (again, comparing cities only to cities, regions only to regions, and states only to states).
For example, among the 100 largest cities, the prosperity score for the Black population is highest in Plano, Texas (with a score of 67), signaling that Black residents of Plano are faring better on the underlying indicators than their counterparts in other cities. Yet Plano’s Black population still experiences significant racial gaps in most index indicators, especially educational attainment and median wages, as shown in the chart below.
The largest equity gaps facing Plano’s Black community are for the indicators of educational attainment, median wage, and poverty/economic insecurity. This snapshot can help advocates contextualize the more detailed data in the National Equity Atlas when comparing equity outcomes within their city and across neighboring or peer cities. Black workers in Plano have a median wage of $23 per hour — higher than the national average of $18 for all Black workers in the United States, but significantly trailing the city’s overall median wage of $29 per hour.
To learn more, see our analysis for some of the key findings for cities and metros, or visit the Racial Equity Index summary page to explore the data for your city, region, or state.
What’s New in the National Equity Atlas
After months of rebuilding the National Equity Atlas, our team is thrilled to share this updated data resource with you!
We are dedicated to maintaining the most comprehensive and user-friendly source of equity indicators deeply disaggregated by race/ethnicity, nativity, gender, ancestry, and income for communities across the nation. And we are committed to providing not just metrics but the story behind the data and trends, and the policy solutions that can work to close racial and economic inequities and move communities toward inclusive prosperity.
Here are the new features and updates you will find in the Atlas:
- The Racial Equity Index: This new index — available for cities, metropolitan regions, states, and the US — allows you to track how well your community is doing on equity compared with other communities (and over time), and identify the most important challenges and areas of progress to develop targeted equity strategies.
- Updated and more robust data: All 30 indicators have been updated with the latest available data (generally 2017). We’ve also added new breakdowns to several indicators, including comparative rankings, disaggregation by race, gender, nativity, and ancestry, and historical data whenever possible.
- State-of-the-art data, visualization, and mapping infrastructure: The technological underpinnings of the Atlas have been upgraded based on the Bay Area Equity Atlas (named a Top Urban Planning Website of 2019 by Planetizen) to instantaneously put equity data at your fingertips to use in policy research, development, advocacy, and community organizing.
- Two new indicators: We added two brand-new indicators: life expectancy and the economic benefits of eliminating rent burdens. The life expectancy indicator replaces several health indicators (asthma, overweight and obese, diabetes) for which updated data was not available.
- More contextual information and updated strategies and examples: We’ve added an introductory page explaining our indicator framework and expanded our indicator pages to provide more information about why these metrics matter for communities and what are the drivers of inequities. We’ve also updated all of our strategies and examples.
- Data and PowerPoint downloads: For the first time, you can easily download all of the data behind the Atlas indicators in spreadsheet format to do your own analyses and create your own visualizations. You can also download PowerPoint slides to add local equity indicators to your presentations.
We hope that you find these new features to be helpful in your equity efforts! We would love to hear your feedback via this short survey and you can always reach us at info@nationalequityatlas.org.
Click Here! Six Key Features in the Updated National Equity Atlas
Since 2014, the National Equity Atlas has served as the nation’s most detailed report card on racial equity. At a time when racial justice is (finally) at the center of our national policy debate, we are thrilled to share this completely updated and strengthened data and policy tool with you!
The National Equity Atlas is a one-stop-shop for data and policy ideas to advance racial equity and shared prosperity. Our focus is providing equity metrics that are deeply disaggregated by race/ethnicity, gender, nativity, ancestry, and income for the largest 100 cities, 150 regions, all 50 states, and the United States as a whole.
We built this site to democratize data and make the facts accessible and actionable to everyone — including the grassroots organizations that possess invaluable firsthand knowledge of inequities yet often lack the resources to gather, analyze, and display the quantitative data so crucial to policy campaigns to address them. At the click of a button, you can see how your community is doing in comparison to other communities according to our Racial Equity Index and 30 relevant, useful, field-tested indicators of racial and economic equity.
Our updated Atlas builds upon our previous data infrastructure but provides a new holistic Racial Equity Index, new indicators, more detailed data for existing indicators, and additional ways to explore, share, and use the data.
Ready to dig in? Here are six essential features to help you explore the indicators in the National Equity Atlas.
1. Racial Equity Index: Start Here
The new Racial Equity Index — available for all geographies in the Atlas — allows you to track how well your community is doing on a set of nine equity indicators compared with other communities (and over time). The index summarizes an inclusion score (which measures racial disparities on nine indicators) and a prosperity score (which measures overall performance levels on those same indicators), and can be further broken down into its components to help you identify the most important challenges and areas of progress to develop targeted equity strategies. You can also examine the prosperity score for each of six major racial/ethnic groups. Here is how to access the index:
A) Go to the Racial Equity Index under Research
B) Go to Racial Equity Index: Summary
C) Choose your geography type (Nation, State, Region, City)
D) Choose your geography from the dropdown menu
E) Explore the data
F) Go back to Racial Equity Index to examine the Prosperity scores for the Black, Latinx, Native American, Asian or Pacific Islander, Mixed/other race, and White Populations.
Here is how the index page looks for Minneapolis-St. Paul metro region.
2. Indicator and Geography Selection Toolbar: Your Home Base
Next, explore the individual indicators in the Atlas. Once you are on the page for any indicator, the first interactive element you will find is the Indicator and Geography Selection Toolbar. This toolbar allows you to choose which of our 30 indicators you want to explore for any of the 272 geographies in the National Equity Atlas. To do so, follow these five steps:
A) Select any indicator, either from the dropdown menu under Indicators or from the Indicators introductory page
B) Choose your indicator group (Demographics, Economic Vitality, Readiness, Connectedness, or Economic Benefits)
C) Choose your indicator from the dropdown menu
D) Choose your geography type (Nation, State, Region, City)
E) Choose your geography from the dropdown menu
Here is how it looks for our Race/ethnicity indicator for the Orlando region:
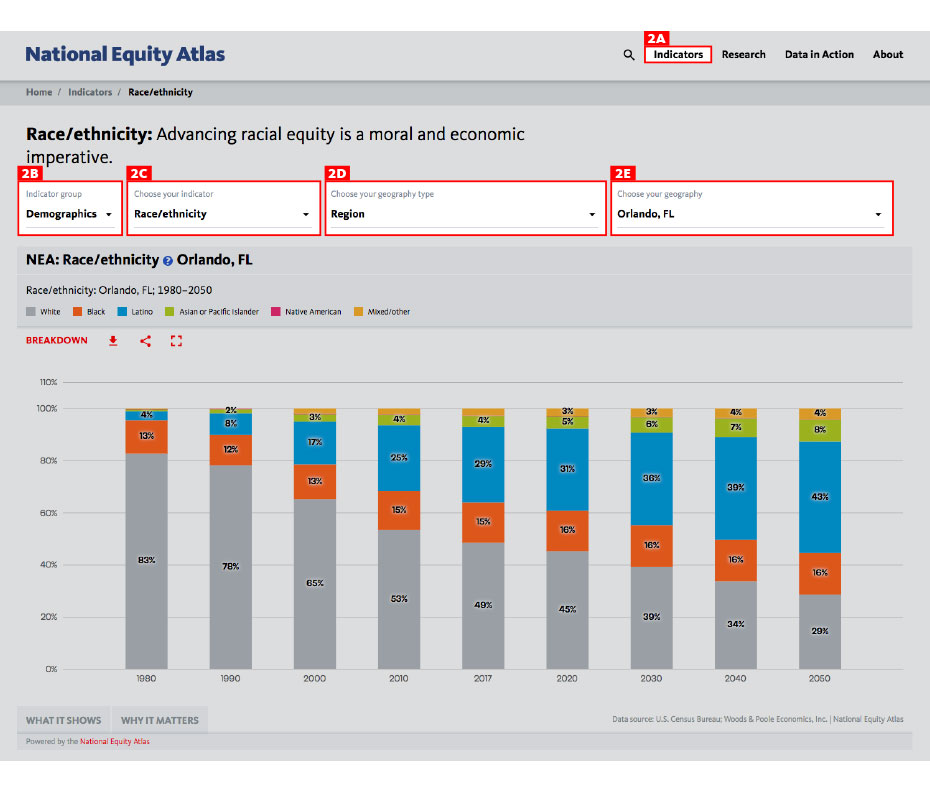
Note that the number of geography types available to you will differ from indicator to indicator, based on data availability. For example, you will not see “City” for the Economic gains: Racial equity in income indicator because data is not available for those smaller geographies for that indicator.
Also, once you are on an indicator page, scroll down for key insights about the indicator, the drivers of inequity, policy solutions to consider, and additional resources.
- MASTER IT: Change the geography and pull up the trend data for a community. What groups are growing and which are shrinking?
3. Chart Breakdowns and Filters: Explore the Data
The Chart Breakdown and Filters feature is the true engine for data exploration in the National Equity Atlas. This is where you can disaggregate the data such as race/ethnicity, race and nativity, race and gender, ancestry, and poverty level. It is also where you can get indicator-specific breakdowns of the data, such as business ownership by race and by industry or commute time by race and transportation mode.
Take these steps to use the Chart Breakdown and Filters feature:
A) Select your breakdown
B) Select one or more filters
Here is how it looks for our Working poor indicator for the city of Albuquerque:
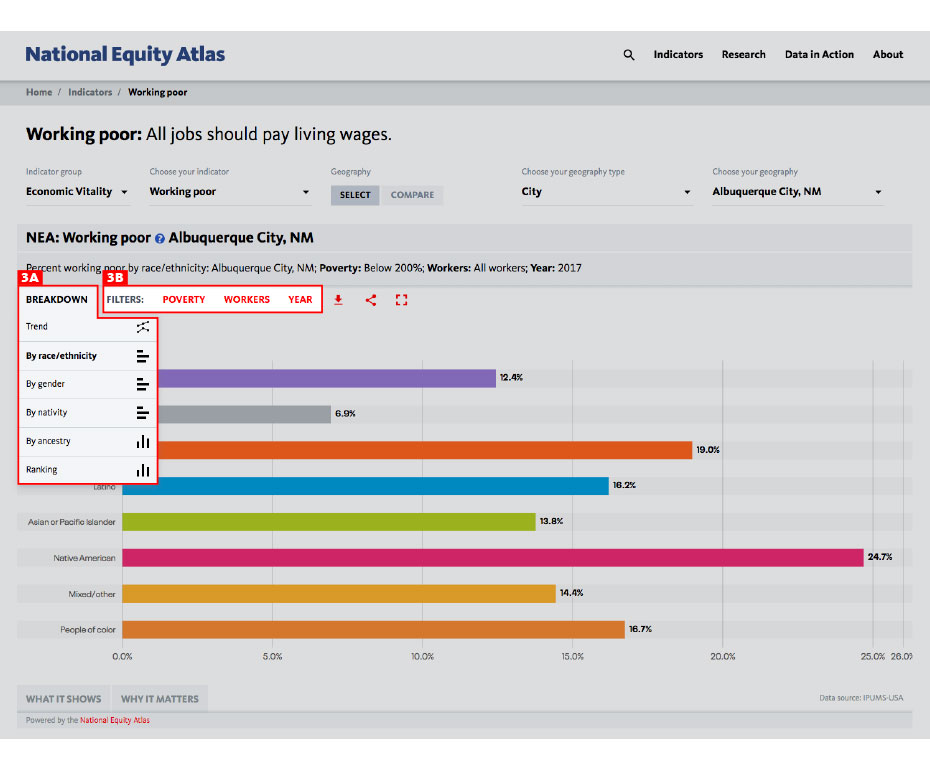
- MASTER IT: Explore the different breakdowns and filters for this indicator. Which groups are most likely to be working full-time but still in poverty or economically insecure (living below 200 percent of poverty) in your community?
4. Compare: See How Your Community Stacks Up
A fourth essential feature — also in the Indicator and Geography Selection Toolbar — is the Compare function. Comparison is a very important method for analyzing equity metrics, allowing you to see how your community (or a group in your community) is doing in relation to other communities (or the same group in a different community). This can help you understand the extent of disparities, assess what are the drivers of inequities, identify strategies to remove barriers, and set goals for progress on eliminating inequities.
Here is how to use the Compare function:
A) Select compare
B) Select a comparison geography type from the dropdown menu
C) Select a comparison geography from the dropdown menu
And this is how it looks for our Working poor indicator, comparing the city of Albuquerque to the state of New Mexico:
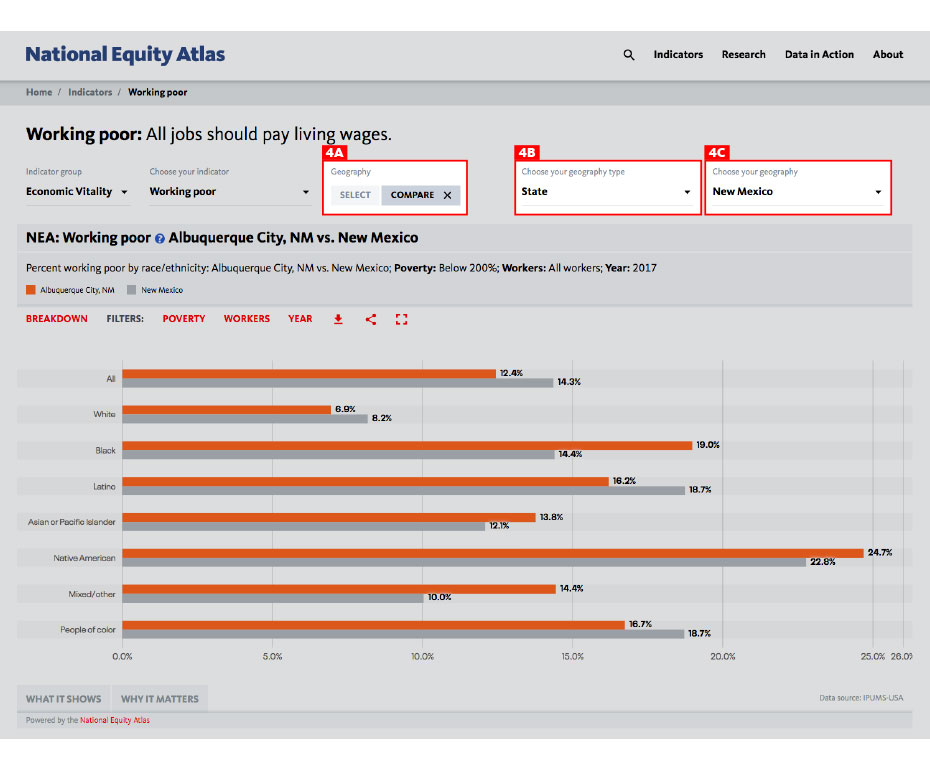
Note that the Compare function is not available for indicator breakdowns that contain multiple categories over multiple years (like the Race/ethnicity indicator you just looked at) because the display would not be legible.
- MASTER IT: Compare working poverty trends in your city and your state.
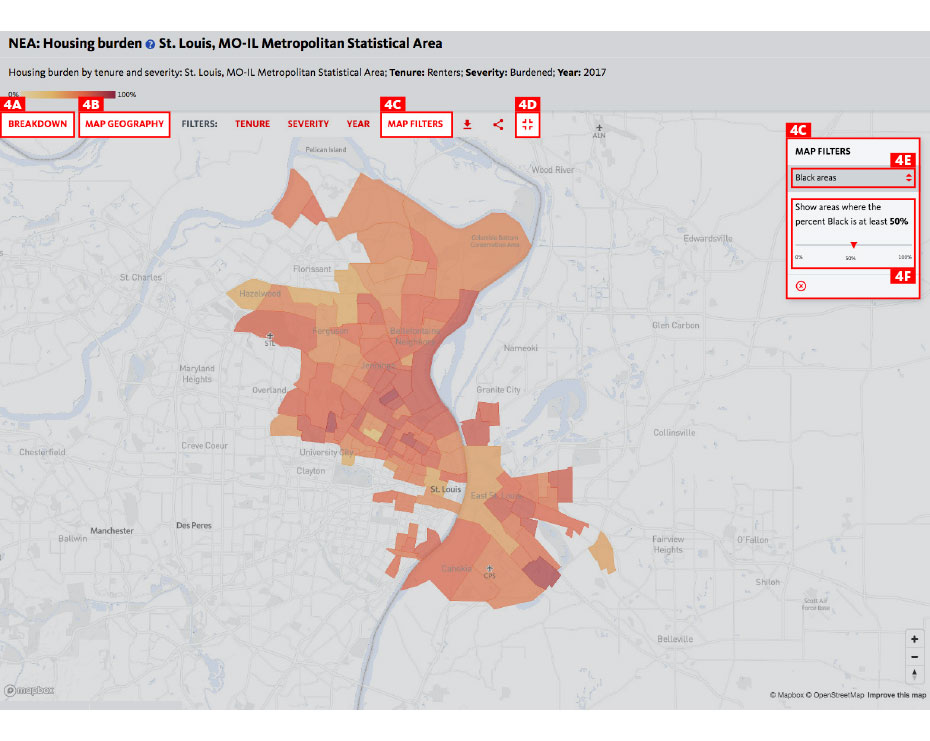
5. Map Filters and Full Extent: Visualizing Patterns
Mapping data by geography puts spatial inequities — which are also racial inequities, due to housing segregation and discrimination — into stark relief. The National Equity Atlas team has worked hard to create a custom mapping system that enables clear visualization of patterns across communities and correlations between race, place, and income.
Follow these steps to Map Filters and Full Extent features:
A) In the chart breakdown, select the map breakdown
B) Under map geography, choose your geography type (Nation, State, Region, City)
C) Select map filters
D) Select map full extent
E) Select a demographic group
F) Use the slider to see how communities with higher and lower shares of your selected demographic group perform on the indicator
Here is how it looks for our Rent burden indicator for the St. Louis metro region, looking at majority Black communities by selecting Percent Black, 50% in the map filter:
6. Downloads and Social Media Buttons: Share and Use Data Visualizations
The National Equity Atlas is a tool for community action, and we wanted to make it easy for you to use the data to highlight issues of inequity, build support for campaigns, and make your case for solutions with policymakers and others in positions of power. We also believe in open data and know that you want to be able to explore the raw data yourself. That’s why we built more sharing and download functionality into the National Equity Atlas.
Follow these steps to access our Download and Sharing features:
A) Select download type (Image or Excel worksheet)
B) Select sharing type (Facebook, Twitter, Email)
Here is how it looks for our Rent burden map for St. Louis:
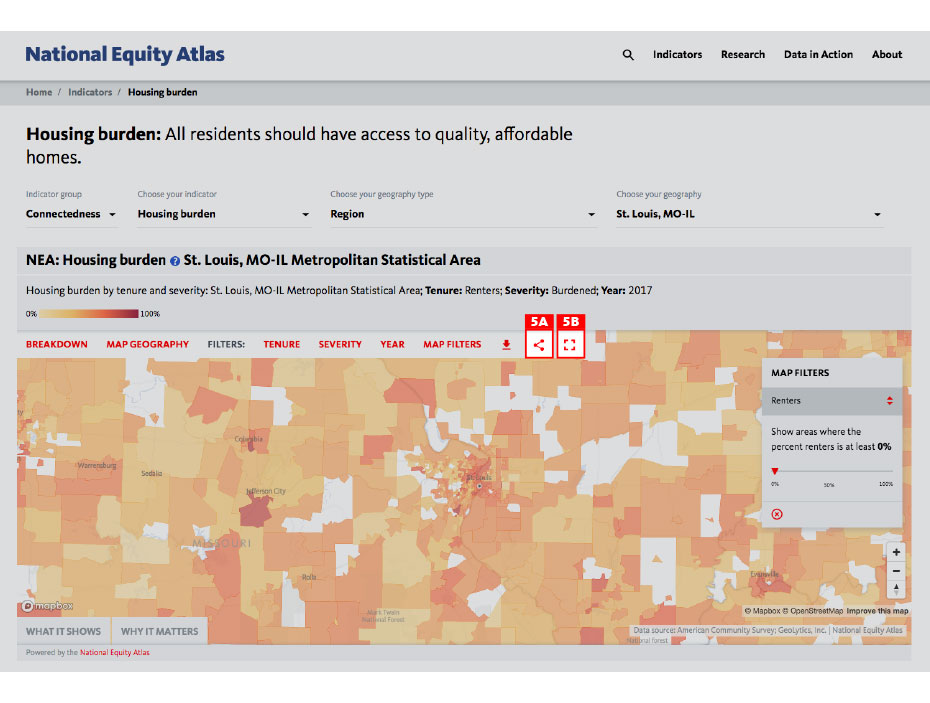
- MASTER IT: Download an Excel file to examine the data behind a chart or map. Post a National Equity Atlas chart or map on your Facebook or Twitter page.
Thank you for exploring the National Equity Atlas! We hope you are excited enough about these features to let your colleagues know about this new tool. We encourage you to join the discussion on social media using the hashtag #equitydata.
The Coming Wave of Covid-19 Evictions: A Growing Crisis for Families in Contra Costa County
Our analysis finds that 14,000 renter households are at imminent risk of eviction if the county’s eviction moratorium expires, with more waves of evictions close behind.
By Jamila Henderson, Sarah Treuhaft, Justin Scoggins, and Alex Werth (East Bay Housing Organizations)*
In the Bay Area, as elsewhere, the coronavirus and its economic fallout have disproportionately impacted the very same people that were on the economic margins before the pandemic, including Black, Latinx, and immigrant communities (especially undocumented workers), and low-wage workers. And they are about to face an additional threat: the risk of being evicted when they can’t pay rent because they’ve lost jobs and income because of the pandemic.
Recognizing the immense harm posed by mass eviction amidst a global health and economic crisis, the Contra Costa County Board of Supervisors passed a moratorium on evictions and rent increases in April 2020, which it extended in May 2020.
Since then, the pandemic has not abated. In fact, the county is now slowing down reopening plans amid escalating infection rates. Yet Contra Costa’s county-wide eviction moratorium is set to expire July 15, placing scores of renters who’ve suffered economic losses during the pandemic at risk of losing their homes.
This analysis, produced in partnership with the Raise the Roof Coalition,** sheds light on the magnitude of this risk by estimating the number of renter households that could face eviction if the moratorium is allowed to expire. See the accompanying fact sheet.
Tens of Thousands of Households at Risk from Coming Waves of Evictions
Our analysis shows that lifting the moratorium at this moment would be disastrous, potentially unleashing a wave of evictions that would devastate workers, families, and their communities. We estimate that 14,000 Contra Costa County households are at imminent risk of eviction if the moratorium is allowed to expire because they include one or more workers who’ve lost their jobs and have no replacement income. Approximately 12,100 children living in these households would also face eviction.
These imminently at-risk households include workers who were either not eligible for unemployment insurance, such as the county’s undocumented immigrant workers and informal workers, or believed they weren’t eligible or faced language and technology barriers and other challenges in filing for benefits. About 65,000 Contra Costa County residents are undocumented immigrants. This is a conservative estimate of those most at-risk: many other households could face eviction if unprotected by the moratorium.
And this will just be the beginning. A second wave of evictions will occur when the Federal Pandemic Unemployment Compensation – which provides a $600 weekly supplement to all workers receiving unemployment benefits – expires on July 31, 2020. Without these additional benefits, about half of workers on UI will have replacement incomes below the federal poverty level, according to the California Policy Lab. This would place an additional 8,700 Contra Costa households at potential risk of eviction due to substantial income loss.
These waves of evictions would come at a time when Contra Costa County is struggling with rising Covid-19 infections and unprecedented job losses. Contra Costa has seen a 65 percent weekly increase in infections as of July 7, one of the worst surges among the six Bay Area counties coordinating to fight Covid-19 (Alameda, Contra Costa, Marin, San Francisco, San Mateo, and Santa Clara). The county was recently added to the California Department of Public Health’s watch list of high-risk counties because of its high case rates and hospitalizations. Contra Costa County is also one of the hardest hit by the recession: 13.6 percent of workers (72,500) were officially unemployed as of May 2020. An additional 26,700 workers have dropped out of the labor force since January and aren’t even included in the official unemployment numbers.
Contra Costa County also has weaker emergency tenant protections than the other counties, except Marin, which is considerably more affluent. After the moratorium ends, Contra Costa renters will have just four months to repay the backlog of rent – potentially thousands of dollars on top of their regular rent – leaving tenants who face eviction with little recourse. In contrast, Alameda, San Francisco, San Mateo, and Santa Clara counties have repayment terms ranging from six to 12 months, with evictions for non-payment of rent due to Covid-19 banned altogether in Alameda and San Francisco.

Mass Eviction Would Devastate Families and the Community, Contributing to Rising Homelessness
Eviction is financially and emotionally devastating to families. It can cause serious harm to mental and physical health, including depression, and negatively affect children’s education. Given that the families imminently at risk of eviction have no income coming in, and most have little to no savings, many could become unhoused. Examining eviction risk in Los Angeles County, UCLA professor Gary Blasi estimated that 10 percent of those evicted due to Covid-19 would become homeless. In 2018, Contra Costa County provided services to 5,846 individuals and families experiencing homelessness; if 10 percent of the currently at-risk households became homeless, that would lead to a 21 percent increase in homelessness. This would cause immeasurable despair and disruption for families. And it would exacerbate the county’s racial inequities: already, Black people represent 34 percent of the county’s unhoused population though they comprise just 8 percent of county residents.
This steep rise in homelessness would also strain community resources, staff, and infrastructure. The county currently spends a minimum of $20,075 per year to shelter one individual. This expense would significantly increase with the potential rise in homeless individuals and families, and only represents a portion of the full costs of homelessness. Cities, nonprofits, housing agencies, and hospitals also provide many homeless services and would also need to allocate more resources to serve a larger number of people experiencing homelessness. Although not insignificant, monetary expenses understate the true costs and long-lasting repercussions of homelessness for individuals and families.
Exacerbating the Housing Crisis for Black, Latinx, and Immigrant Renters
One in three Contra Costa households rent their homes, and this share has been on the rise. Even before the pandemic, the majority of renters in Contra Costa County were already being squeezed by stagnant wages and rising rents, with 53 percent of them rent-burdened, defined as spending more than 30 percent of their income on rent and utilities.
Black, Latinx, and immigrant residents in Contra Costa County are not only more likely to rent versus own their homes, but also more likely to pay too much for their housing. Black and Latinx renters, especially women, face greater risks of eviction and homelessness, as they are more likely to be economically insecure and rent-burdened: 64 percent of renter households headed by Black women and 56 percent of those headed by Latina renters are economically insecure and rent-burdened. As a comparison, only 37 percent of renter households headed by White women and 38 percent of those headed by men of all races/ethnicities experience these conditions.
Renters in Contra Costa continue to face rising economic and housing insecurity, which this crisis has underscored and exacerbated. To make matters worse, nationwide, rent-burdened households have an average savings of just $10, which is grossly insufficient to cover emergency expenses and contributes to the imminent risk of mass eviction.
A Preventable Crisis
Without an effective eviction moratorium and tenant protections, vulnerable renters are at risk of losing their homes. Contra Costa County can only thrive if its renters thrive, and community leaders and policymakers must take every step possible to prevent this potential humanitarian crisis from occurring.
The county can protect renters with these key strategies:
-
Extend the eviction moratorium until 90 days after the state of emergency ends.
-
Ban evictions for non-payment due to Covid-19, converting missed rent to consumer debt.
-
Increase rental assistance, tenant counseling, and legal services for low-income renters.
-
Pass just cause eviction protections and rent control to address gaps in state law.
-
Enact rent and eviction registries to evaluate current policies and ensure equity.
For additional data, and to learn more about how to protect renters in this crisis, read the fact sheet. See the methodology for our data sources and methods of calculating these estimates.
Last updated October 2, 2020.
* Alex Werth, Policy Associate at East Bay Housing Organizations, serves on the Equity Campaign Leaders Advisory Committee of the Bay Area Equity Atlas. East Bay Housing Organizations is a member of the Raise the Roof coalition which produced this analysis in partnership with the Bay Area Equity Atlas.
** Raise the Roof is a coalition of community, labor, and faith groups working to bring good jobs, immigrant protections, and affordable housing to the City of Concord and Contra Costa County. Members include ACCE, California Nurses Association, Central Labor Council Contra Costa County-AFL-CIO, East Bay Alliance for a Sustainable Economy, East Bay Housing Organizations, Ensuring Opportunity, First Five/Central County Regional Group, Lift Up Contra Costa, Monument Impact, and Tenants Together. www.facebook.com/raisetheroofconcord.
National Equity Atlas Update
Dear Atlas Users,
The brutal murder of George Floyd by the Minneapolis police was a stark reminder of the racism that permeates our institutions, threatens Black life, and diminishes us as a nation. We cannot achieve inclusive prosperity without addressing police brutality, and the Atlas team stands in solidarity with those protesting this unjust system and calling for transformative change. We are working hard to finalize the new Atlas system upgrade to share with you later this month, and have been partnering with other data providers to assess the unequal economic impacts of the COVID-19 pandemic by race, gender, nativity, and occupation. Here are a few highlights:
New Analysis: Disaggregated Data on Economic Impacts of COVID-19 for US and 10 Metros
Today, in partnership with Burning Glass Technologies and JPMorgan Chase, we released the most comprehensive analysis to date of the labor market effects of the coronavirus pandemic, aiming to inform equity-focused relief and recovery strategies. In addition to the US, we analyzed 10 metro regions: Boston, Chicago, Columbus, Dallas, Detroit, Los Angeles, Miami, Nashville, San Francisco, and Seattle. Our analysis reveals that people of color and immigrants are concentrated in occupations that have experienced the steepest declines in job opportunities and will likely be among the last to recover, putting Black, Latinx, and Native American workers at heightened risk of long-term unemployment. People of color are also overrepresented in low-wage essential jobs, and Native Americans and immigrants are most concentrated in essential jobs where opportunities are declining. Among the 10 regions, the economic impacts of the virus are uneven: metros with large tourism sectors (like Nashville and Miami) have been hit particularly hard, while diversified regional economies with strong tech sectors (like Seattle and SF) have fared somewhat better. Read the full analysis here.
New Profile of Bay Area Essential Workers
In May, the Bay Area Equity Atlas released three new analyses focused on frontline workers in the region, including two deep dives into workforce demographics in Sonoma and Santa Clara counties. We found that frontline workers in these counties and the Bay overall are disproportionately Latinx, Black, and women of color, which could help explain why these populations are more likely to contract COVID-19. Latinx workers represent 22 percent of workers in all industries but 31 percent of frontline workers while Black workers, who account for just 5 percent of all workers in the region, are concentrated in specific frontline industries including public transit (23 percent) and postal services (11 percent). These workers are more likely to live in poverty, lack health insurance, and have no internet access at home. Read our analyses here. Check out media coverage of this research from KQED, SF Gate, and La Opinion.
National Equity Atlas In the News
- Ron Brownstein at The Atlantic analyzed National Equity Atlas data and corresponded with Atlas team members to inform his new article about how racial inequity is “the crack in the foundation of cities’ new prosperity.” Looking at data on median wages for New York, Los Angeles, Chicago, Houston, Dallas, Atlanta, Miami, Seattle, Denver, Philadelphia, and Minneapolis, he found that racial wage gaps have grown in all of those cities between 1980 and 2015.
- E&E News published an article describing the criticism and subsequent revision of CDC guidelines encouraging workers to commute alone in private vehicles to slow the spread of the coronavirus, lifting up Atlas data showing that nearly 20 percent of Black households and 12 percent of Latinx households do not have access to a car, compared to 6.5 percent of White households. "So yes, there is a race and class bias in saying, 'You can just drive to work,'" said Basav Sen, climate justice project director at the Institute for Policy Studies.
Thank you for your interest in our work.
-- The National Equity Atlas team at PolicyLink and the USC Program for Environmental and Regional Equity (PERE)
National Equity Atlas Update
New Analysis Finds People of Color and Immigrants are Disproportionately Harmed by Labor-Market Impacts of COVID-19
Dear Atlas Users,
The brutal murder of George Floyd by the Minneapolis police was a stark reminder of the racism that permeates our institutions, threatens Black life, and diminishes us as a nation. We cannot achieve inclusive prosperity without addressing police brutality, and the Atlas team stands in solidarity with those protesting this unjust system and calling for transformative change. We are working hard to finalize the new Atlas system upgrade to share with you later this month, and have been partnering with other data providers to assess the unequal economic impacts of the COVID-19 pandemic by race, gender, nativity, and occupation. Here are a few highlights:
New Analysis: Disaggregated Data on Economic Impacts of COVID-19 for US and 10 Metros
Today, in partnership with Burning Glass Technologies and JPMorgan Chase, we released the most comprehensive analysis to date of the labor market effects of the coronavirus pandemic, aiming to inform equity-focused relief and recovery strategies. In addition to the US, we analyzed 10 metro regions: Boston, Chicago, Columbus, Dallas, Detroit, Los Angeles, Miami, Nashville, San Francisco, and Seattle. Our analysis reveals that people of color and immigrants are concentrated in occupations that have experienced the steepest declines in job opportunities and will likely be among the last to recover, putting Black, Latinx, and Native American workers at heightened risk of long-term unemployment. People of color are also overrepresented in low-wage essential jobs, and Native Americans and immigrants are most concentrated in essential jobs where opportunities are declining. Among the 10 regions, the economic impacts of the virus are uneven: metros with large tourism sectors (like Nashville and Miami) have been hit particularly hard, while diversified regional economies with strong tech sectors (like Seattle and SF) have fared somewhat better. Read the full analysis here.
New Profile of Bay Area Essential Workers
In May, the Bay Area Equity Atlas released three new analyses focused on frontline workers in the region, including two deep dives into workforce demographics in Sonoma and Santa Clara counties. We found that frontline workers in these counties and the Bay overall are disproportionately Latinx, Black, and women of color, which could help explain why these populations are more likely to contract COVID-19. Latinx workers represent 22 percent of workers in all industries but 31 percent of frontline workers while Black workers, who account for just 5 percent of all workers in the region, are concentrated in specific frontline industries including public transit (23 percent) and postal services (11 percent). These workers are more likely to live in poverty, lack health insurance, and have no internet access at home. Read our analyses here. Check out media coverage of this research from KQED, SF Gate, and La Opinion.
National Equity Atlas In the News
- Ron Brownstein at The Atlantic analyzed National Equity Atlas data and corresponded with Atlas team members to inform his new article about how racial inequity is “the crack in the foundation of cities’ new prosperity.” Looking at data on median wages for New York, Los Angeles, Chicago, Houston, Dallas, Atlanta, Miami, Seattle, Denver, Philadelphia, and Minneapolis, he found that racial wage gaps have grown in all of those cities between 1980 and 2015.
- E&E News published an article describing the criticism and subsequent revision of CDC guidelines encouraging workers to commute alone in private vehicles to slow the spread of the coronavirus, lifting up Atlas data showing that nearly 20 percent of Black households and 12 percent of Latinx households do not have access to a car, compared to 6.5 percent of White households. "So yes, there is a race and class bias in saying, 'You can just drive to work,'" said Basav Sen, climate justice project director at the Institute for Policy Studies.
Thank you for your interest in our work.
-- The National Equity Atlas team at PolicyLink and the USC Program for Environmental and Regional Equity (PERE)
National Equity Atlas: Join Us to Talk Disaggregated Data and COVID-19 This Friday
Dear Atlas Users,
We hope that you and your families are staying strong through this difficult time. Our team is in the process of determining how we can best support communities in their response to the outbreak, aligned with the solidarity economics prerogative laid out by PERE director Manuel Pastor in this this new op-ed. We hope you will join us on Friday to inform our approach.
Register Now: Community Listening Session Friday at 12 PT/3 ET
As the COVID-19 pandemic continues to unfold, its effects are highlighting and deepening the racial inequities entrenched in our economic system. We know that disaggregated data is a crucial tool to push forward policy solutions that center equity in the short-term and lay the foundation for an inclusive recovery. Please join this listening session with Manuel Pastor, Sarah Treuhaft, and others from the Atlas team from 12-1 PT/3-4 ET this Friday, April 3rd to hear how we are responding to rapidly changing conditions and share your data needs and interests to inform our approach going forward. Register here.
New Fact Sheet: Fair Labor Practices Benefit All New Mexicans
When New Mexican employers deny workers their earnings, they harm families and prevent wages from circulating through the local economy. The New Mexico Worker Organizing Collaborative (NMWOC) works to combat this wage theft, and the Atlas team worked with them to develop a fact sheet showing how Latinx immigrant and Native American workers are disproportionately vulnerable to employer theft and highlighting the challenge of weak enforcement. Our analysis found that twenty percent of open wage theft cases without any activity or investigation have been open for over a year. NMWOC will be using this data in their advocacy to protect workers and take back lost wages. Learn more here.
New Brief: Disrupting the Drivers of Inequity in Biloxi
As wages have stagnated for the majority of workers in the U.S. and inequality has skyrocketed, racial inequity has grown. In Biloxi, Mississippi, these inequities are deep, leaving many Black and Latinx households facing racial and geographic barriers to economic opportunity. The coastal community of East Biloxi has the potential to address some of these inequities through investment in the federal Opportunity Zone program. However, this will only happen if there is an intentional focus on lifting up the most vulnerable communities. Download the brief published in partnership with the East Biloxi Community Collaborative to learn more about how to leverage the Opportunity Zones program to benefit low-income residents and people of color.
Access New Local Data on Life Expectancy
Through the United States Small-Area Life Expectancy Estimates Project’s (USALEEP) new data tool, you can measure and compare differences in life expectancy in nearly every neighborhood across the country with an easy-to-use interactive map. The Robert Wood Johnson Foundation (RWJF) also released updated data for their life expectancy tool which allows users to compare life expectancy in their neighborhood to national averages. These tools will help community leaders examine the factors that may be influencing health differences – such as access to health care, affordable housing, child care, educational opportunities – and target solutions more effectively. Learn more about the USALEEP tool and RWJF tool.
Thank you for your interest in our work!
The National Equity Atlas team at PolicyLink and the USC Program for Environmental and Regional Equity (PERE)
National Equity Atlas Update
Dear Atlas Users,
Our team has been busy behind the scenes getting our new data and interface ready for you, but also made it to DC last month to share our work at Datapalooza. And we are excited to share new research on race and political power in the Bay Area, revealing how one of the nation’s most diverse regions is making some progress, yet has a long way to go toward political inclusion.
New Analysis: Bay Area Diversity Not Reflected Among Top Elected Officials
With all eyes on the presidential primaries, it is easy to forget about what is happening at the local level — yet local electeds make crucial decisions in arenas like policing, housing, and land use that can have significant equity implications. And while the race and gender of elected officials does not alone determine whether they will advance equitable policies, representation matters. This is why the Bay Area Equity Atlas includes the diversity of electeds as a key measure of community power. Today, the Atlas released new data covering the November 2018 and 2019 elections, and a comprehensive analysis in partnership with Bay Rising. While the region has made some progress on political representation over the past two years, it is still lagging behind: people of color hold 29 percent of top elected offices despite making up 60 percent of the population. API and Latinx community members are particularly underrepresented; they make up 50 percent of the population but hold just 20 percent of elected offices. Read more here.
On the Road: The Atlas at Health Datapalooza
Earlier this month, the Atlas team headed to Washington, D.C. for the 2020 Health Datapalooza, a convening of policymakers, regulatory leaders, data analysts, tech start-ups, and community members committed to using data to improve health. To an audience of roughly 50 people, alongside our colleagues from County Health Rankings and Roadmaps and the City Health Dashboard, we discussed data challenges when it comes to existing national surveys and reporting as well as what to do when the most important data does not exist. We highlighted our collection of diversity of electeds in the Bay Area Equity Atlas as one response to this challenge.
Thank you for your interest in our work.
The National Equity Atlas team at PolicyLink and the USC Program for Environmental and Regional Equity (PERE)
National Equity Atlas Update
Dear Atlas Users,
Happy Holidays from the National Equity Atlas team! We are proud of the work we did in 2019 to advance the conversation on equitable growth and equip community leaders with data to power campaigns for racial and economic equity. Here are a few highlights:
Happy Holidays from the National Equity Atlas team! We are proud of the work we did in 2019 to advance the conversation on equitable growth and equip community leaders with data to power campaigns for racial and economic equity. Here are a few highlights:
We launched the Bay Area Equity Atlas!
On June 5th, we released our first local data and policy tool: the Bay Area Equity Atlas. Created in partnership with the San Francisco Foundation, the Atlas includes 21 metrics across the foundation’s People, Place, and Power equity framework and covers 271 geographies in the nine-county region. We’ve been thrilled to see communities using the data to protect renters from displacement, improve outcomes for the Latinx population, and develop equity strategies in the suburbs/exurbs, as well as to read the in-depth stories written by local journalists incorporating our data.

Leveraging Data for Local Policy and Systems Change
The dozens of equity profiles we have produced with local partners over the years continue to inform decision-making, organizing, and policy campaigns. Data from the Cincinnati Equitable Growth Profile helped advocates successfully pass a wage equity policy this March, and that same month our Omaha partners received an American Planning Association award for their work using the profile data to drive equitable planning for health, housing, and transportation. In 2019, we worked with community partners in Long Beach (CA), Orange County (CA), and Pinellas County (FL) to develop equity profiles that are now informing local policy discussions.
New Data Driving the Policy Debate on Inclusive Growth
This year, we added data to the Atlas tracking racial equity in entrepreneurship and business growth. We also produced an analysis that classifies regions according to how their economies are shifting with the rise of tech-driven industries, and what strategies can foster shared prosperity, including case studies of Charlotte, Philadelphia, and Stockton. And, we produced fact sheets to inform the New Mexico Center on Law and Poverty’s campaigns to protect families from predatory financial services.
Atlas in the News
Our data and reports have been covered by various local and national media outlets and articles, and journalists, as well as community leaders, have used our data in op-eds and articles. See this media coverage here.
Thank you for your interest! We are working hard to bring you updated data and a brand new interface in early 2020, and we are excited to reconnect in 2020.
The National Equity Atlas team at PolicyLink and the USC Program for Environmental and Regional Equity (PERE)